Gene Page: TUB
Summary ?
| GeneID | 7275 |
| Symbol | TUB |
| Synonyms | RDOB|rd5 |
| Description | tubby bipartite transcription factor |
| Reference | MIM:601197|HGNC:HGNC:12406|Ensembl:ENSG00000166402|HPRD:03121|Vega:OTTHUMG00000165690 |
| Gene type | protein-coding |
| Map location | 11p15.5 |
| Pascal p-value | 0.261 |
| Sherlock p-value | 0.956 |
| TADA p-value | 0.013 |
| Fetal beta | 0.436 |
| eGene | Cerebellar Hemisphere |
| Support | CompositeSet |
Gene in Data Sources
| Gene set name | Method of gene set | Description | Info |
|---|---|---|---|
| CV:PGCnp | Genome-wide Association Study | GWAS | |
| DNM:Xu_2012 | Whole Exome Sequencing analysis | De novo mutations of 4 genes were identified by exome sequencing of 795 samples in this study |
Section I. Genetics and epigenetics annotation
 DNM table
| Gene | Chromosome | Position | Ref | Alt | Transcript | AA change | Mutation type | Sift | CG46 | Trait | Study |
|---|---|---|---|---|---|---|---|---|---|---|---|
| TUB | chr11 | 8061206 | G | A | NM_003320 | p.57R>K | missense | Schizophrenia | DNM:Xu_2012 |
Section II. Transcriptome annotation
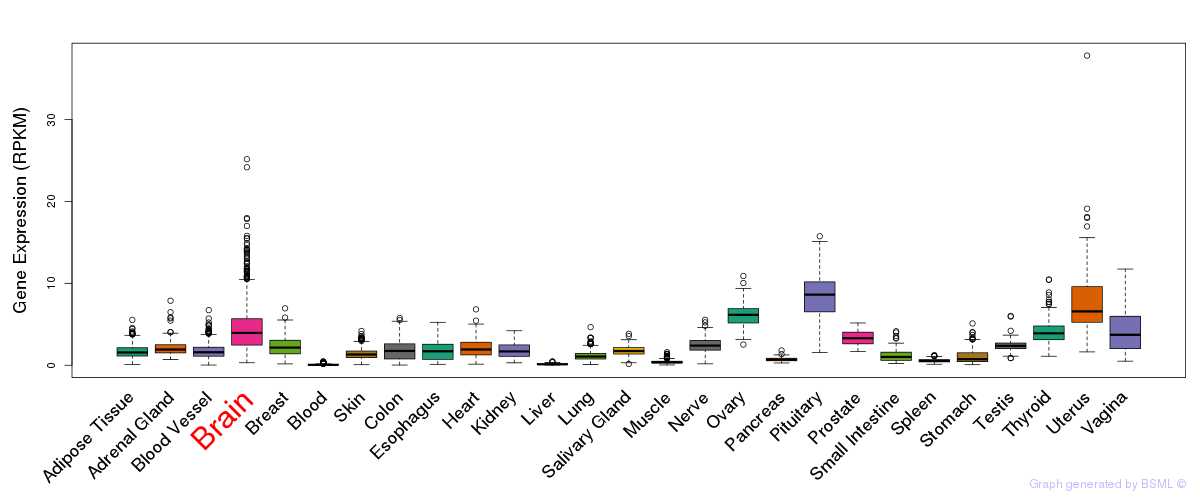
General gene expression (GTEx)
Gene expression during devlopment (BrainCloud)
Footnote:
A total of 269 time points ploted, with n=38 fetal samples (x=1:38). Each triangle represents one time point.
Gene expression of temporal and spatial changes (BrainSpan)
Footnote:
SC: sub-cortical regions; SM: sensory-motor regions; FC: frontal cortex; and TP: temporal-parietal cortex
ST1: fetal (13 - 26 postconception weeks), ST2: early infancy to late childhood (4 months to 11 years), and ST3: adolescence to adulthood (13 - 23 years)
The bar shown representes the lower 25% and upper 25% of the expression distribution.
Top co-expressed genes in brain regions
| Top 10 positively co-expressed genes | ||
| Gene | Pearson's Correlation | Spearman's Correlation |
| IRF1 | 0.78 | 0.81 |
| HLA-F | 0.78 | 0.79 |
| TREX1 | 0.76 | 0.78 |
| TCIRG1 | 0.75 | 0.80 |
| PARP10 | 0.75 | 0.74 |
| TAPBPL | 0.75 | 0.75 |
| IRF9 | 0.74 | 0.84 |
| XAF1 | 0.74 | 0.79 |
| NLRC5 | 0.74 | 0.72 |
| ACOX2 | 0.73 | 0.76 |
| Top 10 negatively co-expressed genes | ||
| Gene | Pearson's Correlation | Spearman's Correlation |
| WDR89 | -0.63 | -0.69 |
| POLR2B | -0.63 | -0.69 |
| ARMCX1 | -0.63 | -0.69 |
| SMS | -0.63 | -0.72 |
| STMN1 | -0.62 | -0.68 |
| SCAND3 | -0.62 | -0.71 |
| CCT8 | -0.62 | -0.69 |
| DHX57 | -0.62 | -0.65 |
| CSE1L | -0.62 | -0.68 |
| VTA1 | -0.62 | -0.66 |
Section V. Pathway annotation
| Pathway name | Pathway size | # SZGR 2.0 genes in pathway | Info |
|---|---|---|---|
| LIU PROSTATE CANCER DN | 481 | 290 | All SZGR 2.0 genes in this pathway |
| COLDREN GEFITINIB RESISTANCE UP | 85 | 57 | All SZGR 2.0 genes in this pathway |
| PEREZ TP53 TARGETS | 1174 | 695 | All SZGR 2.0 genes in this pathway |
| KIM MYCN AMPLIFICATION TARGETS UP | 92 | 64 | All SZGR 2.0 genes in this pathway |
| DOUGLAS BMI1 TARGETS UP | 566 | 371 | All SZGR 2.0 genes in this pathway |
| CREIGHTON ENDOCRINE THERAPY RESISTANCE 2 | 473 | 224 | All SZGR 2.0 genes in this pathway |
| ACEVEDO LIVER CANCER WITH H3K27ME3 DN | 228 | 114 | All SZGR 2.0 genes in this pathway |
| MEISSNER NPC HCP WITH H3K4ME3 AND H3K27ME3 | 142 | 103 | All SZGR 2.0 genes in this pathway |
| MIKKELSEN NPC HCP WITH H3K4ME3 AND H3K27ME3 | 210 | 148 | All SZGR 2.0 genes in this pathway |
| MARTENS TRETINOIN RESPONSE UP | 857 | 456 | All SZGR 2.0 genes in this pathway |
| FIGUEROA AML METHYLATION CLUSTER 5 DN | 50 | 31 | All SZGR 2.0 genes in this pathway |