Gene Page: ALG9
Summary ?
| GeneID | 79796 |
| Symbol | ALG9 |
| Synonyms | CDG1L|DIBD1|LOH11CR1J |
| Description | ALG9, alpha-1,2-mannosyltransferase |
| Reference | MIM:606941|HGNC:HGNC:15672|Ensembl:ENSG00000086848|HPRD:09504|Vega:OTTHUMG00000166819 |
| Gene type | protein-coding |
| Map location | 11q23 |
| Pascal p-value | 0.981 |
| Sherlock p-value | 0.51 |
| Fetal beta | 1.007 |
| DMG | 1 (# studies) |
Gene in Data Sources
| Gene set name | Method of gene set | Description | Info |
|---|---|---|---|
| DMG:Jaffe_2016 | Genome-wide DNA methylation analysis | This dataset includes 2,104 probes/CpGs associated with SZ patients (n=108) compared to 136 controls at Bonferroni-adjusted P < 0.05. | 2 |
| GSMA_I | Genome scan meta-analysis | Psr: 0.006 |
Section I. Genetics and epigenetics annotation
 Differentially methylated gene
| Probe | Chromosome | Position | Nearest gene | P (dis) | Beta (dis) | FDR (dis) | Study |
|---|---|---|---|---|---|---|---|
| cg07508260 | 11 | 111742291 | ALG9 | 1.71E-8 | -0.02 | 6.22E-6 | DMG:Jaffe_2016 |
| cg15276655 | 11 | 111749597 | ALG9 | 2.73E-8 | -0.014 | 8.61E-6 | DMG:Jaffe_2016 |
Section II. Transcriptome annotation
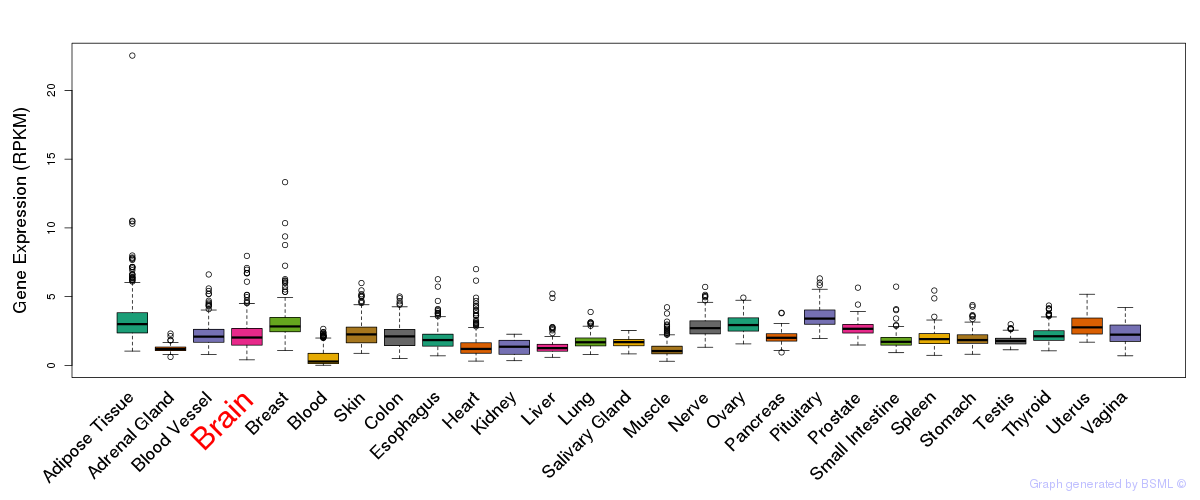
General gene expression (GTEx)
Gene expression during devlopment (BrainCloud)
Footnote:
A total of 269 time points ploted, with n=38 fetal samples (x=1:38). Each triangle represents one time point.
Gene expression of temporal and spatial changes (BrainSpan)
Footnote:
SC: sub-cortical regions; SM: sensory-motor regions; FC: frontal cortex; and TP: temporal-parietal cortex
ST1: fetal (13 - 26 postconception weeks), ST2: early infancy to late childhood (4 months to 11 years), and ST3: adolescence to adulthood (13 - 23 years)
The bar shown representes the lower 25% and upper 25% of the expression distribution.
No co-expressed genes in brain regions
Section III. Gene Ontology annotation
| Molecular function | GO term | Evidence | Neuro keywords | PubMed ID |
|---|---|---|---|---|
| GO:0016757 | transferase activity, transferring glycosyl groups | IEA | - | |
| Cellular component | GO term | Evidence | Neuro keywords | PubMed ID |
| GO:0005789 | endoplasmic reticulum membrane | IEA | - | |
| GO:0005783 | endoplasmic reticulum | IEA | - | |
| GO:0016020 | membrane | IEA | - | |
| GO:0016021 | integral to membrane | IEA | - |
Section V. Pathway annotation
| Pathway name | Pathway size | # SZGR 2.0 genes in pathway | Info |
|---|---|---|---|
| KEGG N GLYCAN BIOSYNTHESIS | 46 | 31 | All SZGR 2.0 genes in this pathway |
| REACTOME METABOLISM OF PROTEINS | 518 | 242 | All SZGR 2.0 genes in this pathway |
| REACTOME POST TRANSLATIONAL PROTEIN MODIFICATION | 188 | 116 | All SZGR 2.0 genes in this pathway |
| REACTOME ASPARAGINE N LINKED GLYCOSYLATION | 81 | 54 | All SZGR 2.0 genes in this pathway |
| REACTOME BIOSYNTHESIS OF THE N GLYCAN PRECURSOR DOLICHOL LIPID LINKED OLIGOSACCHARIDE LLO AND TRANSFER TO A NASCENT PROTEIN | 29 | 17 | All SZGR 2.0 genes in this pathway |
| LASTOWSKA NEUROBLASTOMA COPY NUMBER DN | 800 | 473 | All SZGR 2.0 genes in this pathway |
| PEREZ TP53 TARGETS | 1174 | 695 | All SZGR 2.0 genes in this pathway |
| BENPORATH NANOG TARGETS | 988 | 594 | All SZGR 2.0 genes in this pathway |
| OKUMURA INFLAMMATORY RESPONSE LPS | 183 | 115 | All SZGR 2.0 genes in this pathway |
| XU GH1 AUTOCRINE TARGETS UP | 268 | 157 | All SZGR 2.0 genes in this pathway |
| MARSON BOUND BY FOXP3 STIMULATED | 1022 | 619 | All SZGR 2.0 genes in this pathway |
| MARSON BOUND BY FOXP3 UNSTIMULATED | 1229 | 713 | All SZGR 2.0 genes in this pathway |
| ACEVEDO NORMAL TISSUE ADJACENT TO LIVER TUMOR DN | 354 | 216 | All SZGR 2.0 genes in this pathway |
| MILI PSEUDOPODIA HAPTOTAXIS DN | 668 | 419 | All SZGR 2.0 genes in this pathway |
Section VI. microRNA annotation
| miRNA family | Target position | miRNA ID | miRNA seq | ||
|---|---|---|---|---|---|
| UTR start | UTR end | Match method | |||
| miR-128 | 624 | 630 | 1A | hsa-miR-128a | UCACAGUGAACCGGUCUCUUUU |
| hsa-miR-128b | UCACAGUGAACCGGUCUCUUUC | ||||
| miR-27 | 624 | 630 | m8 | hsa-miR-27abrain | UUCACAGUGGCUAAGUUCCGC |
| hsa-miR-27bbrain | UUCACAGUGGCUAAGUUCUGC | ||||
| miR-30-3p | 489 | 495 | 1A | hsa-miR-30a-3p | CUUUCAGUCGGAUGUUUGCAGC |
| hsa-miR-30e-3p | CUUUCAGUCGGAUGUUUACAGC | ||||
| miR-320 | 3916 | 3923 | 1A,m8 | hsa-miR-320 | AAAAGCUGGGUUGAGAGGGCGAA |
| miR-326 | 1349 | 1355 | 1A | hsa-miR-326 | CCUCUGGGCCCUUCCUCCAG |
| miR-378 | 598 | 604 | 1A | hsa-miR-378 | CUCCUGACUCCAGGUCCUGUGU |
| miR-431 | 540 | 546 | m8 | hsa-miR-431 | UGUCUUGCAGGCCGUCAUGCA |
- SZ: miRNAs which differentially expressed in brain cortex of schizophrenia patients comparing with control samples using microarray. Click here to see the list of SZ related miRNAs.
- Brain: miRNAs which are expressed in brain based on miRNA microarray expression studies. Click here to see the list of brain related miRNAs.