Gene Page: BAIAP2L2
Summary ?
| GeneID | 80115 |
| Symbol | BAIAP2L2 |
| Synonyms | - |
| Description | BAI1 associated protein 2 like 2 |
| Reference | HGNC:HGNC:26203|Ensembl:ENSG00000128298|HPRD:07997|Vega:OTTHUMG00000151197 |
| Gene type | protein-coding |
| Map location | 22q13.1 |
| Pascal p-value | 0.256 |
| Sherlock p-value | 0.861 |
| Fetal beta | -0.476 |
| DMG | 1 (# studies) |
| eGene | Myers' cis & trans |
Gene in Data Sources
| Gene set name | Method of gene set | Description | Info |
|---|---|---|---|
| CV:PGCnp | Genome-wide Association Study | GWAS | |
| DMG:Wockner_2014 | Genome-wide DNA methylation analysis | This dataset includes 4641 differentially methylated probes corresponding to 2929 unique genes between schizophrenia patients (n=24) and controls (n=24). | 2 |
| GO_Annotation | Mapping neuro-related keywords to Gene Ontology annotations | Hits with neuro-related keywords: 2 |
Section I. Genetics and epigenetics annotation
 Differentially methylated gene
| Probe | Chromosome | Position | Nearest gene | P (dis) | Beta (dis) | FDR (dis) | Study |
|---|---|---|---|---|---|---|---|
| cg13868216 | 22 | 38484884 | BAIAP2L2 | 4.988E-4 | 0.41 | 0.047 | DMG:Wockner_2014 |
| cg00430484 | 22 | 38484679 | BAIAP2L2 | 5.667E-4 | 0.319 | 0.049 | DMG:Wockner_2014 |
eQTL annotation
| SNP ID | Chromosome | Position | eGene | Gene Entrez ID | pvalue | qvalue | TSS distance | eQTL type |
|---|---|---|---|---|---|---|---|---|
| rs10484152 | chr14 | 83650540 | BAIAP2L2 | 80115 | 0.19 | trans |
Section II. Transcriptome annotation
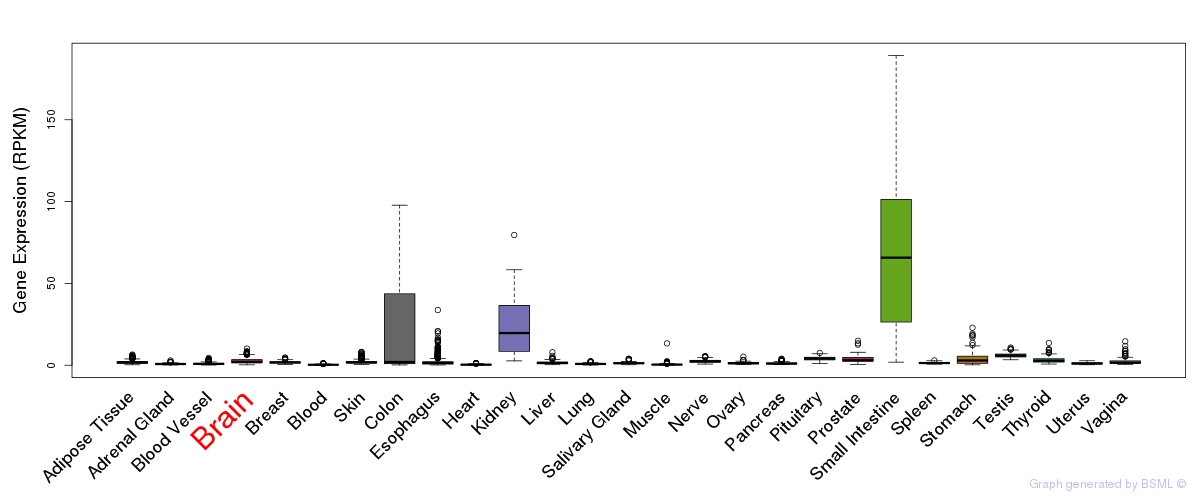
General gene expression (GTEx)
Gene expression during devlopment (BrainCloud)
Footnote:
A total of 269 time points ploted, with n=38 fetal samples (x=1:38). Each triangle represents one time point.
Gene expression of temporal and spatial changes (BrainSpan)
Footnote:
SC: sub-cortical regions; SM: sensory-motor regions; FC: frontal cortex; and TP: temporal-parietal cortex
ST1: fetal (13 - 26 postconception weeks), ST2: early infancy to late childhood (4 months to 11 years), and ST3: adolescence to adulthood (13 - 23 years)
The bar shown representes the lower 25% and upper 25% of the expression distribution.
No co-expressed genes in brain regions
Section III. Gene Ontology annotation
| Biological process | GO term | Evidence | Neuro keywords | PubMed ID |
|---|---|---|---|---|
| GO:0046847 | filopodium formation | IEA | axon (GO term level: 10) | - |
| GO:0007399 | nervous system development | IEA | neurite (GO term level: 5) | - |
| GO:0007165 | signal transduction | IEA | - | |
| Cellular component | GO term | Evidence | Neuro keywords | PubMed ID |
| GO:0005634 | nucleus | IDA | 18029348 | |
| GO:0005737 | cytoplasm | IDA | 18029348 | |
| GO:0005739 | mitochondrion | IDA | 18029348 |
Section V. Pathway annotation
| Pathway name | Pathway size | # SZGR 2.0 genes in pathway | Info |
|---|---|---|---|
| ODONNELL METASTASIS UP | 82 | 58 | All SZGR 2.0 genes in this pathway |
| PATIL LIVER CANCER | 747 | 453 | All SZGR 2.0 genes in this pathway |
| FORTSCHEGGER PHF8 TARGETS DN | 784 | 464 | All SZGR 2.0 genes in this pathway |