Gene Page: GDPD5
Summary ?
| GeneID | 81544 |
| Symbol | GDPD5 |
| Synonyms | GDE2|PP1665 |
| Description | glycerophosphodiester phosphodiesterase domain containing 5 |
| Reference | MIM:609632|HGNC:HGNC:28804|Ensembl:ENSG00000158555|HPRD:15159|Vega:OTTHUMG00000165484 |
| Gene type | protein-coding |
| Map location | 11q13.4-q13.5 |
| Pascal p-value | 0.312 |
| Sherlock p-value | 0.754 |
| Fetal beta | 0.39 |
| DMG | 1 (# studies) |
| eGene | Myers' cis & trans |
| Support | CompositeSet |
Gene in Data Sources
| Gene set name | Method of gene set | Description | Info |
|---|---|---|---|
| CV:PGCnp | Genome-wide Association Study | GWAS | |
| DMG:Wockner_2014 | Genome-wide DNA methylation analysis | This dataset includes 4641 differentially methylated probes corresponding to 2929 unique genes between schizophrenia patients (n=24) and controls (n=24). | 2 |
| DNM:Fromer_2014 | Whole Exome Sequencing analysis | This study reported a WES study of 623 schizophrenia trios, reporting DNMs using genomic DNA. |
Section I. Genetics and epigenetics annotation
 DNM table
| Gene | Chromosome | Position | Ref | Alt | Transcript | AA change | Mutation type | Sift | CG46 | Trait | Study |
|---|---|---|---|---|---|---|---|---|---|---|---|
| GDPD5 | chr11 | 75152811 | C | T | NM_030792 | p.402R>Q | missense | Schizophrenia | DNM:Fromer_2014 |
Differentially methylated gene
| Probe | Chromosome | Position | Nearest gene | P (dis) | Beta (dis) | FDR (dis) | Study |
|---|---|---|---|---|---|---|---|
| cg24212471 | 11 | 75180067 | GDPD5 | 3.835E-4 | 0.435 | 0.043 | DMG:Wockner_2014 |
| cg01374565 | 11 | 75236762 | GDPD5 | 5.688E-4 | -0.21 | 0.049 | DMG:Wockner_2014 |
eQTL annotation
| SNP ID | Chromosome | Position | eGene | Gene Entrez ID | pvalue | qvalue | TSS distance | eQTL type |
|---|---|---|---|---|---|---|---|---|
| rs828895 | chr2 | 74339309 | GDPD5 | 81544 | 0.12 | trans | ||
| rs16829545 | chr2 | 151977407 | GDPD5 | 81544 | 4.41E-4 | trans | ||
| rs3845734 | chr2 | 171125572 | GDPD5 | 81544 | 1.696E-4 | trans | ||
| rs7584986 | chr2 | 184111432 | GDPD5 | 81544 | 9.006E-7 | trans | ||
| rs2183142 | chr4 | 159232695 | GDPD5 | 81544 | 0.02 | trans | ||
| rs1929780 | chr6 | 40757438 | GDPD5 | 81544 | 0.18 | trans | ||
| rs1929769 | chr6 | 40765977 | GDPD5 | 81544 | 0.06 | trans | ||
| rs16922210 | chr9 | 105594398 | GDPD5 | 81544 | 0.08 | trans | ||
| rs3853290 | chr10 | 708359 | GDPD5 | 81544 | 0.08 | trans | ||
| rs11253324 | chr10 | 743835 | GDPD5 | 81544 | 0.08 | trans | ||
| rs16955618 | chr15 | 29937543 | GDPD5 | 81544 | 1.143E-11 | trans | ||
| rs16978352 | chr18 | 42944875 | GDPD5 | 81544 | 0.04 | trans | ||
| rs1507467 | chr18 | 73755746 | GDPD5 | 81544 | 0.13 | trans |
Section II. Transcriptome annotation
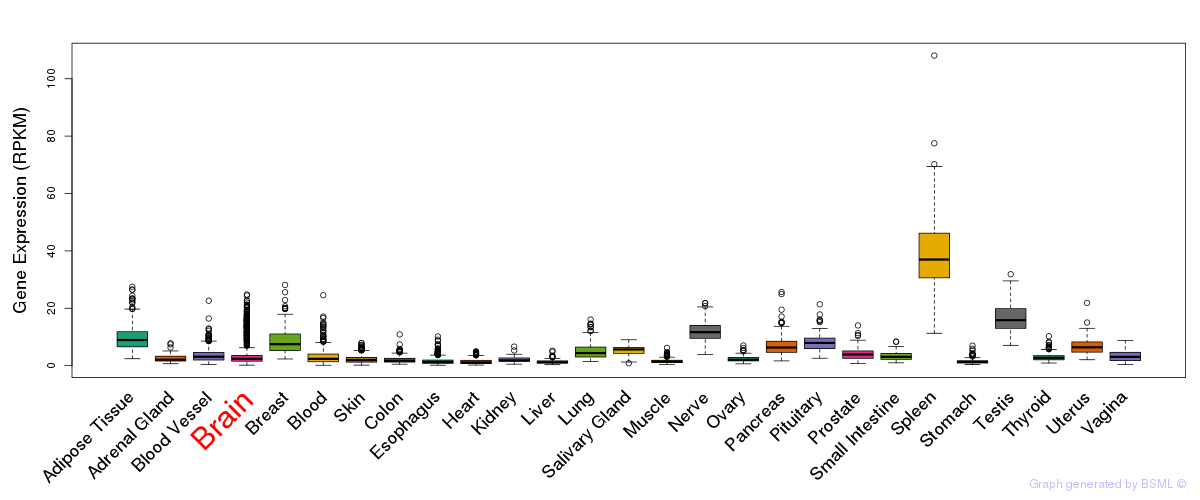
General gene expression (GTEx)
Gene expression during devlopment (BrainCloud)
Footnote:
A total of 269 time points ploted, with n=38 fetal samples (x=1:38). Each triangle represents one time point.
Gene expression of temporal and spatial changes (BrainSpan)
Footnote:
SC: sub-cortical regions; SM: sensory-motor regions; FC: frontal cortex; and TP: temporal-parietal cortex
ST1: fetal (13 - 26 postconception weeks), ST2: early infancy to late childhood (4 months to 11 years), and ST3: adolescence to adulthood (13 - 23 years)
The bar shown representes the lower 25% and upper 25% of the expression distribution.
Top co-expressed genes in brain regions
| Top 10 positively co-expressed genes | ||
| Gene | Pearson's Correlation | Spearman's Correlation |
| ZNF385A | 0.66 | 0.70 |
| C1QTNF1 | 0.66 | 0.63 |
| AIFM3 | 0.65 | 0.61 |
| ANGPTL4 | 0.61 | 0.61 |
| UBTD1 | 0.61 | 0.64 |
| FAM151A | 0.60 | 0.63 |
| ALDH4A1 | 0.60 | 0.63 |
| SCARA3 | 0.60 | 0.66 |
| ZBTB7B | 0.60 | 0.64 |
| AL132868.3 | 0.59 | 0.57 |
| Top 10 negatively co-expressed genes | ||
| Gene | Pearson's Correlation | Spearman's Correlation |
| RTDR1 | -0.52 | -0.61 |
| STMN1 | -0.51 | -0.58 |
| EXOC6 | -0.51 | -0.56 |
| PVRL3 | -0.51 | -0.58 |
| FRG1 | -0.51 | -0.56 |
| NPY5R | -0.50 | -0.59 |
| SNRPB2 | -0.50 | -0.58 |
| CYP2R1 | -0.50 | -0.56 |
| SYT4 | -0.50 | -0.59 |
| ZNF642 | -0.50 | -0.54 |
Section V. Pathway annotation
| Pathway name | Pathway size | # SZGR 2.0 genes in pathway | Info |
|---|---|---|---|
| TONKS TARGETS OF RUNX1 RUNX1T1 FUSION GRANULOCYTE DN | 17 | 13 | All SZGR 2.0 genes in this pathway |
| UDAYAKUMAR MED1 TARGETS DN | 240 | 171 | All SZGR 2.0 genes in this pathway |
| SENESE HDAC3 TARGETS DN | 536 | 332 | All SZGR 2.0 genes in this pathway |
| DODD NASOPHARYNGEAL CARCINOMA UP | 1821 | 933 | All SZGR 2.0 genes in this pathway |
| GOZGIT ESR1 TARGETS UP | 149 | 84 | All SZGR 2.0 genes in this pathway |
| PEREZ TP53 TARGETS | 1174 | 695 | All SZGR 2.0 genes in this pathway |
| MORI SMALL PRE BII LYMPHOCYTE UP | 86 | 57 | All SZGR 2.0 genes in this pathway |
| MORI IMMATURE B LYMPHOCYTE UP | 53 | 35 | All SZGR 2.0 genes in this pathway |
| NIKOLSKY BREAST CANCER 11Q12 Q14 AMPLICON | 158 | 93 | All SZGR 2.0 genes in this pathway |
| ASTIER INTEGRIN SIGNALING | 59 | 44 | All SZGR 2.0 genes in this pathway |
| BAELDE DIABETIC NEPHROPATHY UP | 86 | 48 | All SZGR 2.0 genes in this pathway |
| ENGELMANN CANCER PROGENITORS UP | 48 | 31 | All SZGR 2.0 genes in this pathway |
| HOFFMANN LARGE TO SMALL PRE BII LYMPHOCYTE DN | 72 | 47 | All SZGR 2.0 genes in this pathway |
| HOFFMANN IMMATURE TO MATURE B LYMPHOCYTE DN | 50 | 36 | All SZGR 2.0 genes in this pathway |
| SENGUPTA EBNA1 ANTICORRELATED | 173 | 85 | All SZGR 2.0 genes in this pathway |
| LI INDUCED T TO NATURAL KILLER UP | 307 | 182 | All SZGR 2.0 genes in this pathway |
| KATSANOU ELAVL1 TARGETS UP | 169 | 105 | All SZGR 2.0 genes in this pathway |
| DELACROIX RARG BOUND MEF | 367 | 231 | All SZGR 2.0 genes in this pathway |
| FORTSCHEGGER PHF8 TARGETS DN | 784 | 464 | All SZGR 2.0 genes in this pathway |