Gene Page: MADCAM1
Summary ?
| GeneID | 8174 |
| Symbol | MADCAM1 |
| Synonyms | MACAM1 |
| Description | mucosal vascular addressin cell adhesion molecule 1 |
| Reference | MIM:102670|HGNC:HGNC:6765|Ensembl:ENSG00000099866|HPRD:00035|Vega:OTTHUMG00000180548 |
| Gene type | protein-coding |
| Map location | 19p13.3 |
| Pascal p-value | 0.146 |
| Fetal beta | -0.475 |
| DMG | 1 (# studies) |
| eGene | Cerebellar Hemisphere Cerebellum Cortex Meta |
Gene in Data Sources
| Gene set name | Method of gene set | Description | Info |
|---|---|---|---|
| DMG:Jaffe_2016 | Genome-wide DNA methylation analysis | This dataset includes 2,104 probes/CpGs associated with SZ patients (n=108) compared to 136 controls at Bonferroni-adjusted P < 0.05. | 1 |
Section I. Genetics and epigenetics annotation
 Differentially methylated gene
| Probe | Chromosome | Position | Nearest gene | P (dis) | Beta (dis) | FDR (dis) | Study |
|---|---|---|---|---|---|---|---|
| cg04607160 | 19 | 488565 | MADCAM1 | 1.39E-10 | -0.013 | 4.91E-7 | DMG:Jaffe_2016 |
Section II. Transcriptome annotation
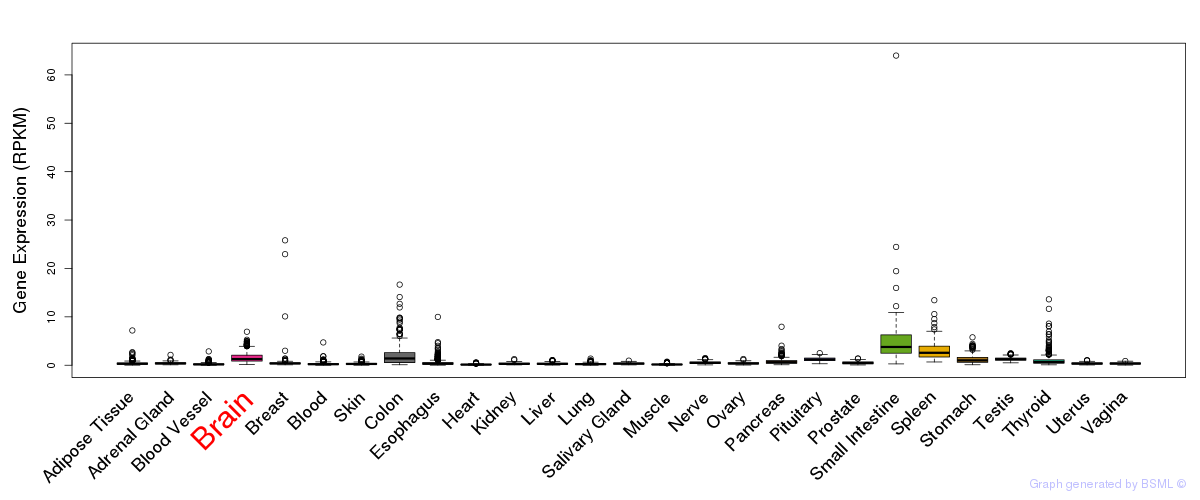
General gene expression (GTEx)
Gene expression during devlopment (BrainCloud)
Footnote:
A total of 269 time points ploted, with n=38 fetal samples (x=1:38). Each triangle represents one time point.
Gene expression of temporal and spatial changes (BrainSpan)
Footnote:
SC: sub-cortical regions; SM: sensory-motor regions; FC: frontal cortex; and TP: temporal-parietal cortex
ST1: fetal (13 - 26 postconception weeks), ST2: early infancy to late childhood (4 months to 11 years), and ST3: adolescence to adulthood (13 - 23 years)
The bar shown representes the lower 25% and upper 25% of the expression distribution.
Top co-expressed genes in brain regions
| Top 10 positively co-expressed genes | ||
| Gene | Pearson's Correlation | Spearman's Correlation |
| MUL1 | 0.80 | 0.80 |
| CLPTM1L | 0.79 | 0.79 |
| SEC23B | 0.78 | 0.77 |
| MAEA | 0.77 | 0.77 |
| DGCR2 | 0.77 | 0.77 |
| PDE12 | 0.77 | 0.78 |
| METTL13 | 0.77 | 0.77 |
| TRIM35 | 0.76 | 0.78 |
| KLHL12 | 0.76 | 0.75 |
| USP30 | 0.76 | 0.79 |
| Top 10 negatively co-expressed genes | ||
| Gene | Pearson's Correlation | Spearman's Correlation |
| AC098691.2 | -0.64 | -0.66 |
| AF347015.21 | -0.63 | -0.65 |
| MT-CO2 | -0.63 | -0.62 |
| FXYD1 | -0.62 | -0.60 |
| AF347015.8 | -0.59 | -0.60 |
| AF347015.31 | -0.59 | -0.60 |
| AF347015.33 | -0.58 | -0.57 |
| CXCL14 | -0.57 | -0.59 |
| HIGD1B | -0.57 | -0.59 |
| AC021016.1 | -0.57 | -0.56 |
Section V. Pathway annotation
| Pathway name | Pathway size | # SZGR 2.0 genes in pathway | Info |
|---|---|---|---|
| KEGG CELL ADHESION MOLECULES CAMS | 134 | 93 | All SZGR 2.0 genes in this pathway |
| KEGG INTESTINAL IMMUNE NETWORK FOR IGA PRODUCTION | 48 | 36 | All SZGR 2.0 genes in this pathway |
| PID INTEGRIN5 PATHWAY | 17 | 9 | All SZGR 2.0 genes in this pathway |
| BENPORATH ES WITH H3K27ME3 | 1118 | 744 | All SZGR 2.0 genes in this pathway |
| NUMATA CSF3 SIGNALING VIA STAT3 | 22 | 17 | All SZGR 2.0 genes in this pathway |
| WU HBX TARGETS 2 DN | 16 | 11 | All SZGR 2.0 genes in this pathway |
| WU HBX TARGETS 1 DN | 23 | 14 | All SZGR 2.0 genes in this pathway |
| BLALOCK ALZHEIMERS DISEASE UP | 1691 | 1088 | All SZGR 2.0 genes in this pathway |
| KAAB FAILED HEART ATRIUM UP | 38 | 30 | All SZGR 2.0 genes in this pathway |
| YOSHIMURA MAPK8 TARGETS UP | 1305 | 895 | All SZGR 2.0 genes in this pathway |
| MIKKELSEN IPS LCP WITH H3K4ME3 | 174 | 100 | All SZGR 2.0 genes in this pathway |
| WANG TNF TARGETS | 24 | 17 | All SZGR 2.0 genes in this pathway |
| PURBEY TARGETS OF CTBP1 NOT SATB1 UP | 344 | 215 | All SZGR 2.0 genes in this pathway |