Gene Page: YPEL3
Summary ?
| GeneID | 83719 |
| Symbol | YPEL3 |
| Synonyms | - |
| Description | yippee like 3 |
| Reference | MIM:609724|HGNC:HGNC:18327|Ensembl:ENSG00000090238|HPRD:15683|Vega:OTTHUMG00000176853 |
| Gene type | protein-coding |
| Map location | 16p11.2 |
| Pascal p-value | 1.761E-6 |
| Sherlock p-value | 0.102 |
| Fetal beta | -0.887 |
| eGene | Cerebellar Hemisphere Cerebellum |
Gene in Data Sources
| Gene set name | Method of gene set | Description | Info |
|---|---|---|---|
| CNV:YES | Copy number variation studies | Manual curation | |
| CV:PGCnp | Genome-wide Association Study | GWAS | |
| DMG:Wockner_2014 | Genome-wide DNA methylation analysis | This dataset includes 4641 differentially methylated probes corresponding to 2929 unique genes between schizophrenia patients (n=24) and controls (n=24). | 1 |
| GSMA_IIE | Genome scan meta-analysis (European-ancestry samples) | Psr: 0.01775 |
Section I. Genetics and epigenetics annotation
 Differentially methylated gene
| Probe | Chromosome | Position | Nearest gene | P (dis) | Beta (dis) | FDR (dis) | Study |
|---|---|---|---|---|---|---|---|
| cg05417332 | 16 | 30104025 | YPEL3;TBX6 | 7.11E-5 | -0.462 | 0.025 | DMG:Wockner_2014 |
Section II. Transcriptome annotation
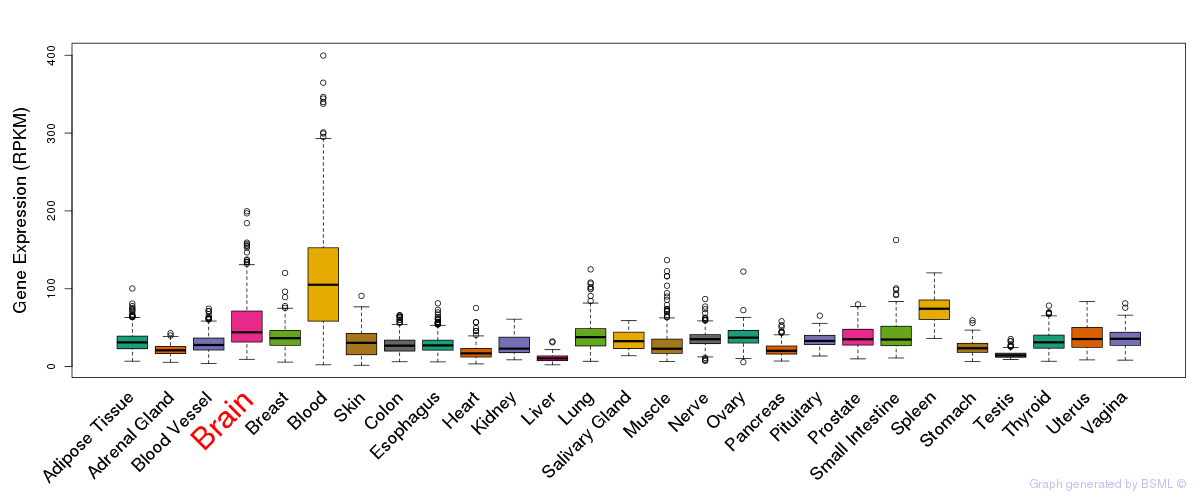
General gene expression (GTEx)
Gene expression during devlopment (BrainCloud)
Footnote:
A total of 269 time points ploted, with n=38 fetal samples (x=1:38). Each triangle represents one time point.
Gene expression of temporal and spatial changes (BrainSpan)
Footnote:
SC: sub-cortical regions; SM: sensory-motor regions; FC: frontal cortex; and TP: temporal-parietal cortex
ST1: fetal (13 - 26 postconception weeks), ST2: early infancy to late childhood (4 months to 11 years), and ST3: adolescence to adulthood (13 - 23 years)
The bar shown representes the lower 25% and upper 25% of the expression distribution.
Top co-expressed genes in brain regions
| Top 10 positively co-expressed genes | ||
| Gene | Pearson's Correlation | Spearman's Correlation |
| CCDC88C | 0.76 | 0.54 |
| CCDC96 | 0.75 | 0.63 |
| MPPE1 | 0.74 | 0.65 |
| REM2 | 0.73 | 0.59 |
| AC021087.1 | 0.73 | 0.52 |
| FAM40B | 0.73 | 0.28 |
| RGS2 | 0.72 | 0.50 |
| RXRG | 0.71 | 0.11 |
| DRD2 | 0.71 | 0.50 |
| PLCB2 | 0.71 | 0.52 |
| Top 10 negatively co-expressed genes | ||
| Gene | Pearson's Correlation | Spearman's Correlation |
| AF347015.31 | -0.39 | -0.49 |
| AF347015.2 | -0.39 | -0.46 |
| AF347015.8 | -0.38 | -0.48 |
| MT-CO2 | -0.38 | -0.48 |
| AF347015.15 | -0.38 | -0.47 |
| AF347015.21 | -0.37 | -0.48 |
| AF347015.33 | -0.35 | -0.46 |
| AF347015.27 | -0.35 | -0.46 |
| MT-CYB | -0.35 | -0.45 |
| MT-ATP8 | -0.35 | -0.45 |
Section V. Pathway annotation
| Pathway name | Pathway size | # SZGR 2.0 genes in pathway | Info |
|---|---|---|---|
| WANG CLIM2 TARGETS UP | 269 | 146 | All SZGR 2.0 genes in this pathway |
| KINSEY TARGETS OF EWSR1 FLII FUSION DN | 329 | 219 | All SZGR 2.0 genes in this pathway |
| DODD NASOPHARYNGEAL CARCINOMA UP | 1821 | 933 | All SZGR 2.0 genes in this pathway |
| LINDGREN BLADDER CANCER CLUSTER 1 DN | 378 | 231 | All SZGR 2.0 genes in this pathway |
| BERENJENO TRANSFORMED BY RHOA DN | 394 | 258 | All SZGR 2.0 genes in this pathway |
| PEREZ TP53 TARGETS | 1174 | 695 | All SZGR 2.0 genes in this pathway |
| HATADA METHYLATED IN LUNG CANCER UP | 390 | 236 | All SZGR 2.0 genes in this pathway |
| FERREIRA EWINGS SARCOMA UNSTABLE VS STABLE DN | 98 | 59 | All SZGR 2.0 genes in this pathway |
| BRACHAT RESPONSE TO CISPLATIN | 22 | 11 | All SZGR 2.0 genes in this pathway |
| HU GENOTOXIN ACTION DIRECT VS INDIRECT 24HR | 55 | 38 | All SZGR 2.0 genes in this pathway |
| BILD MYC ONCOGENIC SIGNATURE | 206 | 117 | All SZGR 2.0 genes in this pathway |
| CREIGHTON ENDOCRINE THERAPY RESISTANCE 5 | 482 | 296 | All SZGR 2.0 genes in this pathway |
| IWANAGA CARCINOGENESIS BY KRAS PTEN DN | 353 | 226 | All SZGR 2.0 genes in this pathway |
| CHANG CORE SERUM RESPONSE DN | 209 | 137 | All SZGR 2.0 genes in this pathway |
| ZHANG TLX TARGETS 36HR UP | 221 | 150 | All SZGR 2.0 genes in this pathway |
| ZHANG TLX TARGETS 60HR UP | 293 | 203 | All SZGR 2.0 genes in this pathway |
| YAO TEMPORAL RESPONSE TO PROGESTERONE CLUSTER 0 | 76 | 54 | All SZGR 2.0 genes in this pathway |
| HOELZEL NF1 TARGETS DN | 115 | 73 | All SZGR 2.0 genes in this pathway |
| DUTERTRE ESTRADIOL RESPONSE 6HR DN | 91 | 56 | All SZGR 2.0 genes in this pathway |
| BHAT ESR1 TARGETS VIA AKT1 DN | 82 | 51 | All SZGR 2.0 genes in this pathway |
| LEE BMP2 TARGETS UP | 745 | 475 | All SZGR 2.0 genes in this pathway |
| GOBERT OLIGODENDROCYTE DIFFERENTIATION DN | 1080 | 713 | All SZGR 2.0 genes in this pathway |
| ZWANG EGF INTERVAL DN | 214 | 124 | All SZGR 2.0 genes in this pathway |
Section VI. microRNA annotation
| miRNA family | Target position | miRNA ID | miRNA seq | ||
|---|---|---|---|---|---|
| UTR start | UTR end | Match method | |||
| miR-128 | 146 | 153 | 1A,m8 | hsa-miR-128a | UCACAGUGAACCGGUCUCUUUU |
| hsa-miR-128b | UCACAGUGAACCGGUCUCUUUC | ||||
| miR-148/152 | 144 | 150 | m8 | hsa-miR-148a | UCAGUGCACUACAGAACUUUGU |
| hsa-miR-152brain | UCAGUGCAUGACAGAACUUGGG | ||||
| hsa-miR-148b | UCAGUGCAUCACAGAACUUUGU | ||||
| miR-27 | 301 | 307 | 1A | hsa-miR-27abrain | UUCACAGUGGCUAAGUUCCGC |
| hsa-miR-27bbrain | UUCACAGUGGCUAAGUUCUGC | ||||
| hsa-miR-27abrain | UUCACAGUGGCUAAGUUCCGC | ||||
| hsa-miR-27bbrain | UUCACAGUGGCUAAGUUCUGC | ||||
| miR-28 | 118 | 124 | m8 | hsa-miR-28brain | AAGGAGCUCACAGUCUAUUGAG |
- SZ: miRNAs which differentially expressed in brain cortex of schizophrenia patients comparing with control samples using microarray. Click here to see the list of SZ related miRNAs.
- Brain: miRNAs which are expressed in brain based on miRNA microarray expression studies. Click here to see the list of brain related miRNAs.