Gene Page: TFAP2D
Summary ?
| GeneID | 83741 |
| Symbol | TFAP2D |
| Synonyms | TFAP2BL1 |
| Description | transcription factor AP-2 delta (activating enhancer binding protein 2 delta) |
| Reference | MIM:610161|HGNC:HGNC:15581|Ensembl:ENSG00000008197|HPRD:11627|Vega:OTTHUMG00000014832 |
| Gene type | protein-coding |
| Map location | 6p12.1 |
| Pascal p-value | 0.024 |
| TADA p-value | 0.011 |
| Fetal beta | 0.812 |
| DMG | 1 (# studies) |
| Support | CompositeSet |
Gene in Data Sources
| Gene set name | Method of gene set | Description | Info |
|---|---|---|---|
| CV:PGCnp | Genome-wide Association Study | GWAS | |
| DMG:Wockner_2014 | Genome-wide DNA methylation analysis | This dataset includes 4641 differentially methylated probes corresponding to 2929 unique genes between schizophrenia patients (n=24) and controls (n=24). | 1 |
| DNM:Fromer_2014 | Whole Exome Sequencing analysis | This study reported a WES study of 623 schizophrenia trios, reporting DNMs using genomic DNA. | |
| GSMA_IIE | Genome scan meta-analysis (European-ancestry samples) | Psr: 0.04433 |
Section I. Genetics and epigenetics annotation
 DNM table
| Gene | Chromosome | Position | Ref | Alt | Transcript | AA change | Mutation type | Sift | CG46 | Trait | Study |
|---|---|---|---|---|---|---|---|---|---|---|---|
| TFAP2D | chr6 | 50740408 | C | G | NM_172238 | p.397T>S | missense | Schizophrenia | DNM:Fromer_2014 |
Differentially methylated gene
| Probe | Chromosome | Position | Nearest gene | P (dis) | Beta (dis) | FDR (dis) | Study |
|---|---|---|---|---|---|---|---|
| cg06804433 | 6 | 50682485 | TFAP2D | 4.019E-4 | -0.557 | 0.044 | DMG:Wockner_2014 |
Section II. Transcriptome annotation
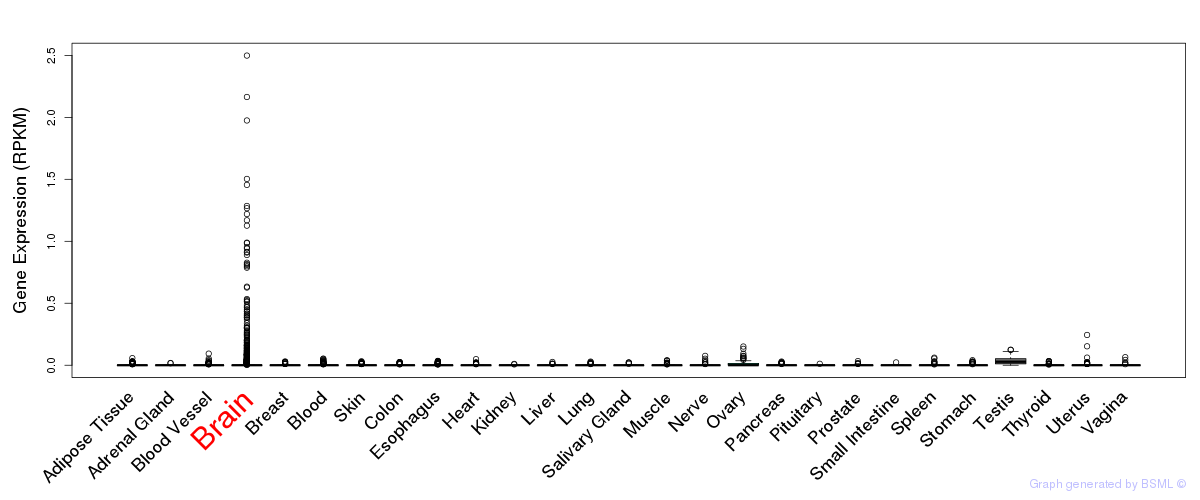
General gene expression (GTEx)
Gene expression during devlopment (BrainCloud)
Footnote:
A total of 269 time points ploted, with n=38 fetal samples (x=1:38). Each triangle represents one time point.
Gene expression of temporal and spatial changes (BrainSpan)
Footnote:
SC: sub-cortical regions; SM: sensory-motor regions; FC: frontal cortex; and TP: temporal-parietal cortex
ST1: fetal (13 - 26 postconception weeks), ST2: early infancy to late childhood (4 months to 11 years), and ST3: adolescence to adulthood (13 - 23 years)
The bar shown representes the lower 25% and upper 25% of the expression distribution.
Top co-expressed genes in brain regions
| Top 10 positively co-expressed genes | ||
| Gene | Pearson's Correlation | Spearman's Correlation |
| PEA15 | 0.67 | 0.69 |
| PARVA | 0.65 | 0.67 |
| BCKDHB | 0.64 | 0.64 |
| FUCA2 | 0.62 | 0.62 |
| GBAS | 0.62 | 0.62 |
| ATPAF1 | 0.61 | 0.67 |
| SGCE | 0.61 | 0.63 |
| GATM | 0.60 | 0.63 |
| SNX5 | 0.60 | 0.61 |
| TOR1AIP1 | 0.60 | 0.63 |
| Top 10 negatively co-expressed genes | ||
| Gene | Pearson's Correlation | Spearman's Correlation |
| KLHL1 | -0.38 | -0.13 |
| DACT1 | -0.35 | -0.13 |
| DAB1 | -0.33 | -0.11 |
| NEUROD6 | -0.33 | -0.16 |
| TMEM108 | -0.32 | -0.11 |
| SLC35F2 | -0.32 | -0.11 |
| SH2D2A | -0.32 | -0.33 |
| RP9P | -0.32 | -0.36 |
| NEUROD2 | -0.31 | -0.12 |
| SLA | -0.31 | -0.09 |
Section III. Gene Ontology annotation
| Molecular function | GO term | Evidence | Neuro keywords | PubMed ID |
|---|---|---|---|---|
| GO:0003700 | transcription factor activity | IEA | - | |
| GO:0005515 | protein binding | IEA | - | |
| GO:0016563 | transcription activator activity | IEA | - | |
| Biological process | GO term | Evidence | Neuro keywords | PubMed ID |
| GO:0006355 | regulation of transcription, DNA-dependent | IEA | - | |
| GO:0006350 | transcription | IEA | - | |
| Cellular component | GO term | Evidence | Neuro keywords | PubMed ID |
| GO:0005634 | nucleus | IEA | - | |
| GO:0005667 | transcription factor complex | IEA | - |
Section V. Pathway annotation
| Pathway name | Pathway size | # SZGR 2.0 genes in pathway | Info |
|---|---|---|---|
| BENPORATH EED TARGETS | 1062 | 725 | All SZGR 2.0 genes in this pathway |
| BENPORATH ES WITH H3K27ME3 | 1118 | 744 | All SZGR 2.0 genes in this pathway |
| KONDO PROSTATE CANCER WITH H3K27ME3 | 196 | 93 | All SZGR 2.0 genes in this pathway |
| MIKKELSEN IPS WITH HCP H3K27ME3 | 102 | 76 | All SZGR 2.0 genes in this pathway |
| MIKKELSEN NPC HCP WITH H3K27ME3 | 341 | 243 | All SZGR 2.0 genes in this pathway |
| MIKKELSEN MEF HCP WITH H3K27ME3 | 590 | 403 | All SZGR 2.0 genes in this pathway |
| ZWANG TRANSIENTLY UP BY 2ND EGF PULSE ONLY | 1725 | 838 | All SZGR 2.0 genes in this pathway |
Section VI. microRNA annotation
| miRNA family | Target position | miRNA ID | miRNA seq | ||
|---|---|---|---|---|---|
| UTR start | UTR end | Match method | |||
| miR-133 | 88 | 94 | 1A | hsa-miR-133a | UUGGUCCCCUUCAACCAGCUGU |
| hsa-miR-133b | UUGGUCCCCUUCAACCAGCUA | ||||
| miR-15/16/195/424/497 | 34 | 40 | m8 | hsa-miR-15abrain | UAGCAGCACAUAAUGGUUUGUG |
| hsa-miR-16brain | UAGCAGCACGUAAAUAUUGGCG | ||||
| hsa-miR-15bbrain | UAGCAGCACAUCAUGGUUUACA | ||||
| hsa-miR-195SZ | UAGCAGCACAGAAAUAUUGGC | ||||
| hsa-miR-424 | CAGCAGCAAUUCAUGUUUUGAA | ||||
| hsa-miR-497 | CAGCAGCACACUGUGGUUUGU | ||||
- SZ: miRNAs which differentially expressed in brain cortex of schizophrenia patients comparing with control samples using microarray. Click here to see the list of SZ related miRNAs.
- Brain: miRNAs which are expressed in brain based on miRNA microarray expression studies. Click here to see the list of brain related miRNAs.