Gene Page: NOA1
Summary ?
| GeneID | 84273 |
| Symbol | NOA1 |
| Synonyms | C4orf14|MTG3|hAtNOS1|hNOA1|mAtNOS1 |
| Description | nitric oxide associated 1 |
| Reference | MIM:614919|HGNC:HGNC:28473|HPRD:12823| |
| Gene type | protein-coding |
| Map location | 4q12 |
| Pascal p-value | 0.859 |
| Sherlock p-value | 0.782 |
| Fetal beta | 1.124 |
| DMG | 1 (# studies) |
Gene in Data Sources
| Gene set name | Method of gene set | Description | Info |
|---|---|---|---|
| CV:GWASdb | Genome-wide Association Studies | GWASdb records for schizophrenia | |
| CV:PGCnp | Genome-wide Association Study | GWAS | |
| DMG:Jaffe_2016 | Genome-wide DNA methylation analysis | This dataset includes 2,104 probes/CpGs associated with SZ patients (n=108) compared to 136 controls at Bonferroni-adjusted P < 0.05. | 1 |
Section I. Genetics and epigenetics annotation
 Differentially methylated gene
| Probe | Chromosome | Position | Nearest gene | P (dis) | Beta (dis) | FDR (dis) | Study |
|---|---|---|---|---|---|---|---|
| cg03761979 | 4 | 57843892 | NOA1 | 1.48E-9 | -0.01 | 1.4E-6 | DMG:Jaffe_2016 |
eQTL annotation
| SNP ID | Chromosome | Position | eGene | Gene Entrez ID | pvalue | qvalue | TSS distance | eQTL type |
|---|---|---|---|---|---|---|---|---|
| rs421360 | chr2 | 183561783 | C4orf14 | 84273 | 0.08 | trans | ||
| rs1881097 | chr2 | 183589512 | C4orf14 | 84273 | 0.08 | trans | ||
| rs1847200 | chr4 | 160550920 | C4orf14 | 84273 | 0.1 | trans | ||
| rs16916054 | chr11 | 91158732 | C4orf14 | 84273 | 0.04 | trans |
Section II. Transcriptome annotation
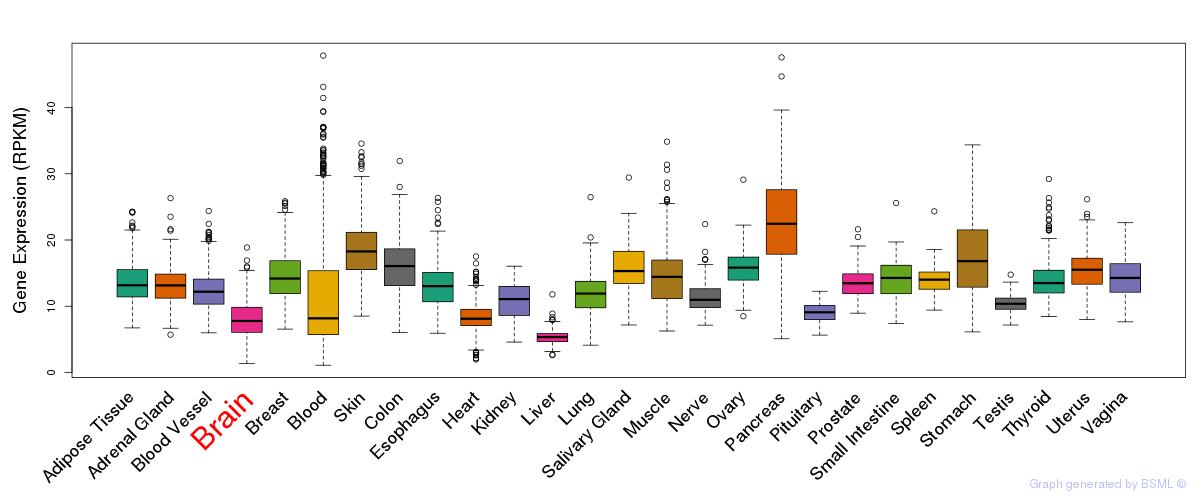
General gene expression (GTEx)
Gene expression during devlopment (BrainCloud)
Footnote:
A total of 269 time points ploted, with n=38 fetal samples (x=1:38). Each triangle represents one time point.
Gene expression of temporal and spatial changes (BrainSpan)
Footnote:
SC: sub-cortical regions; SM: sensory-motor regions; FC: frontal cortex; and TP: temporal-parietal cortex
ST1: fetal (13 - 26 postconception weeks), ST2: early infancy to late childhood (4 months to 11 years), and ST3: adolescence to adulthood (13 - 23 years)
The bar shown representes the lower 25% and upper 25% of the expression distribution.
No co-expressed genes in brain regions
Section V. Pathway annotation
| Pathway name | Pathway size | # SZGR 2.0 genes in pathway | Info |
|---|---|---|---|
| ZHOU INFLAMMATORY RESPONSE LIVE DN | 384 | 220 | All SZGR 2.0 genes in this pathway |
| WANG LMO4 TARGETS UP | 372 | 227 | All SZGR 2.0 genes in this pathway |
| HEIDENBLAD AMPLICON 12P11 12 DN | 30 | 16 | All SZGR 2.0 genes in this pathway |
| DAIRKEE TERT TARGETS UP | 380 | 213 | All SZGR 2.0 genes in this pathway |
| MONNIER POSTRADIATION TUMOR ESCAPE UP | 393 | 244 | All SZGR 2.0 genes in this pathway |
| ACEVEDO LIVER TUMOR VS NORMAL ADJACENT TISSUE UP | 863 | 514 | All SZGR 2.0 genes in this pathway |
| BHATI G2M ARREST BY 2METHOXYESTRADIOL DN | 127 | 75 | All SZGR 2.0 genes in this pathway |
| LEE BMP2 TARGETS DN | 882 | 538 | All SZGR 2.0 genes in this pathway |
| VANOEVELEN MYOGENESIS SIN3A TARGETS | 220 | 133 | All SZGR 2.0 genes in this pathway |