Gene Page: EBPL
Summary ?
| GeneID | 84650 |
| Symbol | EBPL |
| Synonyms | EBRP |
| Description | emopamil binding protein like |
| Reference | HGNC:HGNC:18061|Ensembl:ENSG00000123179|HPRD:13258|Vega:OTTHUMG00000016920 |
| Gene type | protein-coding |
| Map location | 13q12-q13 |
| Pascal p-value | 0.018 |
| Sherlock p-value | 0.444 |
| Fetal beta | 0.884 |
| eGene | Anterior cingulate cortex BA24 Caudate basal ganglia Cerebellar Hemisphere Cerebellum Cortex Frontal Cortex BA9 Hippocampus Hypothalamus Nucleus accumbens basal ganglia Putamen basal ganglia Myers' cis & trans Meta |
Gene in Data Sources
| Gene set name | Method of gene set | Description | Info |
|---|---|---|---|
| CV:GWASdb | Genome-wide Association Studies | GWASdb records for schizophrenia | |
| CV:PGCnp | Genome-wide Association Study | GWAS |
Section I. Genetics and epigenetics annotation
 eQTL annotation
| SNP ID | Chromosome | Position | eGene | Gene Entrez ID | pvalue | qvalue | TSS distance | eQTL type |
|---|---|---|---|---|---|---|---|---|
| rs3809325 | chr13 | 50266108 | EBPL | 84650 | 0.01 | cis | ||
| rs9526596 | chr13 | 50322332 | EBPL | 84650 | 0.01 | cis | ||
| rs10903077 | chr1 | 24393281 | EBPL | 84650 | 0.18 | trans | ||
| rs4649175 | chr1 | 24406646 | EBPL | 84650 | 0.12 | trans | ||
| rs4313343 | chr1 | 24408413 | EBPL | 84650 | 0.13 | trans | ||
| rs11256386 | chr10 | 9962552 | EBPL | 84650 | 0.2 | trans | ||
| rs7317456 | 13 | 50261338 | EBPL | ENSG00000123179.9 | 5.196E-7 | 0.01 | 4273 | gtex_brain_ba24 |
| rs9568308 | 13 | 50265238 | EBPL | ENSG00000123179.9 | 5.404E-7 | 0.01 | 373 | gtex_brain_ba24 |
| rs201854049 | 13 | 50281833 | EBPL | ENSG00000123179.9 | 1.483E-6 | 0.01 | -16222 | gtex_brain_ba24 |
| rs9562915 | 13 | 50283389 | EBPL | ENSG00000123179.9 | 3.958E-6 | 0.01 | -17778 | gtex_brain_ba24 |
| rs9535304 | 13 | 50287966 | EBPL | ENSG00000123179.9 | 1.693E-6 | 0.01 | -22355 | gtex_brain_ba24 |
| rs9568313 | 13 | 50291611 | EBPL | ENSG00000123179.9 | 1.693E-6 | 0.01 | -26000 | gtex_brain_ba24 |
| rs9535308 | 13 | 50291860 | EBPL | ENSG00000123179.9 | 1.693E-6 | 0.01 | -26249 | gtex_brain_ba24 |
| rs9535313 | 13 | 50297263 | EBPL | ENSG00000123179.9 | 2.863E-6 | 0.01 | -31652 | gtex_brain_ba24 |
| rs7982132 | 13 | 50300502 | EBPL | ENSG00000123179.9 | 1.963E-6 | 0.01 | -34891 | gtex_brain_ba24 |
| rs9596183 | 13 | 50307834 | EBPL | ENSG00000123179.9 | 1.963E-6 | 0.01 | -42223 | gtex_brain_ba24 |
| rs9596186 | 13 | 50312102 | EBPL | ENSG00000123179.9 | 1.962E-6 | 0.01 | -46491 | gtex_brain_ba24 |
| rs9596187 | 13 | 50312107 | EBPL | ENSG00000123179.9 | 1.962E-6 | 0.01 | -46496 | gtex_brain_ba24 |
| rs9568317 | 13 | 50314004 | EBPL | ENSG00000123179.9 | 1.962E-6 | 0.01 | -48393 | gtex_brain_ba24 |
| rs3782930 | 13 | 50317222 | EBPL | ENSG00000123179.9 | 1.962E-6 | 0.01 | -51611 | gtex_brain_ba24 |
| rs7338721 | 13 | 50320590 | EBPL | ENSG00000123179.9 | 1.962E-6 | 0.01 | -54979 | gtex_brain_ba24 |
| rs9526596 | 13 | 50322333 | EBPL | ENSG00000123179.9 | 1.962E-6 | 0.01 | -56722 | gtex_brain_ba24 |
| rs9562919 | 13 | 50323808 | EBPL | ENSG00000123179.9 | 1.962E-6 | 0.01 | -58197 | gtex_brain_ba24 |
| rs9535319 | 13 | 50325647 | EBPL | ENSG00000123179.9 | 1.969E-6 | 0.01 | -60036 | gtex_brain_ba24 |
| rs9535321 | 13 | 50325811 | EBPL | ENSG00000123179.9 | 1.963E-6 | 0.01 | -60200 | gtex_brain_ba24 |
| rs2146437 | 13 | 50327036 | EBPL | ENSG00000123179.9 | 1.636E-6 | 0.01 | -61425 | gtex_brain_ba24 |
| rs2897771 | 13 | 50330335 | EBPL | ENSG00000123179.9 | 1.963E-6 | 0.01 | -64724 | gtex_brain_ba24 |
| rs9535328 | 13 | 50334693 | EBPL | ENSG00000123179.9 | 1.961E-6 | 0.01 | -69082 | gtex_brain_ba24 |
| rs9535334 | 13 | 50343886 | EBPL | ENSG00000123179.9 | 1.963E-6 | 0.01 | -78275 | gtex_brain_ba24 |
| rs9535335 | 13 | 50349924 | EBPL | ENSG00000123179.9 | 1.822E-6 | 0.01 | -84313 | gtex_brain_ba24 |
| rs9568330 | 13 | 50353353 | EBPL | ENSG00000123179.9 | 4.583E-6 | 0.01 | -87742 | gtex_brain_ba24 |
| rs6561563 | 13 | 50353997 | EBPL | ENSG00000123179.9 | 1.963E-6 | 0.01 | -88386 | gtex_brain_ba24 |
| rs112332160 | 13 | 50277342 | EBPL | ENSG00000123179.9 | 1.098E-7 | 0.01 | -11731 | gtex_brain_putamen_basal |
| rs201854049 | 13 | 50281833 | EBPL | ENSG00000123179.9 | 3.618E-6 | 0.01 | -16222 | gtex_brain_putamen_basal |
| rs9562915 | 13 | 50283389 | EBPL | ENSG00000123179.9 | 1.165E-7 | 0.01 | -17778 | gtex_brain_putamen_basal |
| rs2146437 | 13 | 50327036 | EBPL | ENSG00000123179.9 | 3.228E-6 | 0.01 | -61425 | gtex_brain_putamen_basal |
| rs1407636 | 13 | 50333882 | EBPL | ENSG00000123179.9 | 1.165E-7 | 0.01 | -68271 | gtex_brain_putamen_basal |
Section II. Transcriptome annotation
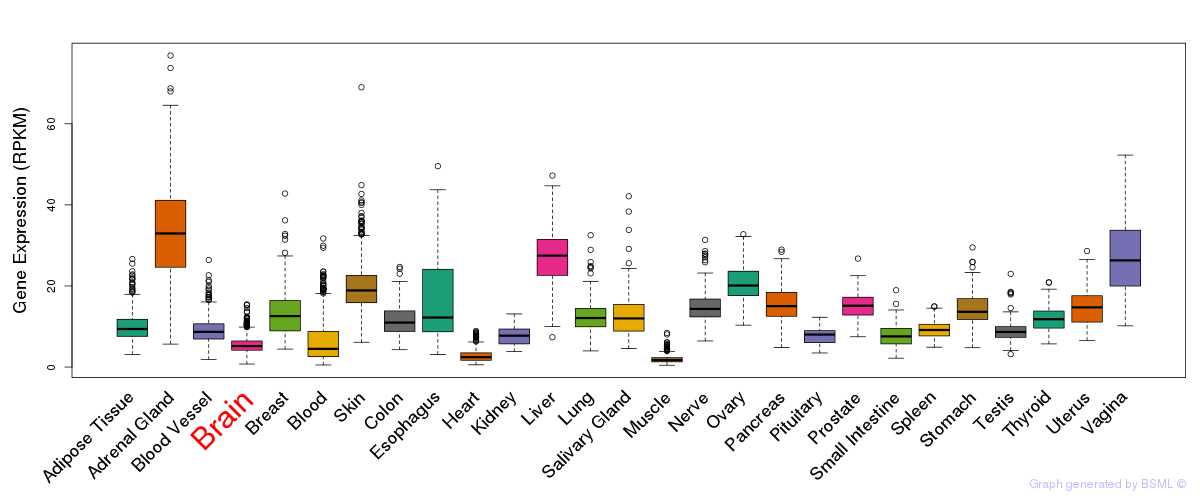
General gene expression (GTEx)
Gene expression during devlopment (BrainCloud)
Footnote:
A total of 269 time points ploted, with n=38 fetal samples (x=1:38). Each triangle represents one time point.
Gene expression of temporal and spatial changes (BrainSpan)
Footnote:
SC: sub-cortical regions; SM: sensory-motor regions; FC: frontal cortex; and TP: temporal-parietal cortex
ST1: fetal (13 - 26 postconception weeks), ST2: early infancy to late childhood (4 months to 11 years), and ST3: adolescence to adulthood (13 - 23 years)
The bar shown representes the lower 25% and upper 25% of the expression distribution.
No co-expressed genes in brain regions
Section V. Pathway annotation
| Pathway name | Pathway size | # SZGR 2.0 genes in pathway | Info |
|---|---|---|---|
| HORIUCHI WTAP TARGETS DN | 310 | 188 | All SZGR 2.0 genes in this pathway |
| OSMAN BLADDER CANCER DN | 406 | 230 | All SZGR 2.0 genes in this pathway |
| JAATINEN HEMATOPOIETIC STEM CELL UP | 316 | 190 | All SZGR 2.0 genes in this pathway |
| GRAESSMANN APOPTOSIS BY DOXORUBICIN DN | 1781 | 1082 | All SZGR 2.0 genes in this pathway |
| DAIRKEE TERT TARGETS UP | 380 | 213 | All SZGR 2.0 genes in this pathway |
| KIM MYC AMPLIFICATION TARGETS UP | 201 | 127 | All SZGR 2.0 genes in this pathway |
| NUYTTEN NIPP1 TARGETS UP | 769 | 437 | All SZGR 2.0 genes in this pathway |
| TCGA GLIOBLASTOMA COPY NUMBER DN | 31 | 21 | All SZGR 2.0 genes in this pathway |
| JIANG VHL TARGETS | 138 | 91 | All SZGR 2.0 genes in this pathway |
| JIANG HYPOXIA CANCER | 83 | 52 | All SZGR 2.0 genes in this pathway |
| KRIGE RESPONSE TO TOSEDOSTAT 6HR DN | 911 | 527 | All SZGR 2.0 genes in this pathway |
| KRIGE RESPONSE TO TOSEDOSTAT 24HR DN | 1011 | 592 | All SZGR 2.0 genes in this pathway |
| KONDO PROSTATE CANCER HCP WITH H3K27ME3 | 97 | 72 | All SZGR 2.0 genes in this pathway |
| ACEVEDO LIVER CANCER DN | 540 | 340 | All SZGR 2.0 genes in this pathway |
| CHIANG LIVER CANCER SUBCLASS CTNNB1 UP | 176 | 110 | All SZGR 2.0 genes in this pathway |
| CHIANG LIVER CANCER SUBCLASS UNANNOTATED DN | 193 | 112 | All SZGR 2.0 genes in this pathway |
| KATSANOU ELAVL1 TARGETS UP | 169 | 105 | All SZGR 2.0 genes in this pathway |