Gene Page: FOXH1
Summary ?
| GeneID | 8928 |
| Symbol | FOXH1 |
| Synonyms | FAST-1|FAST1 |
| Description | forkhead box H1 |
| Reference | MIM:603621|HGNC:HGNC:3814|Ensembl:ENSG00000160973|HPRD:04689|Vega:OTTHUMG00000165172 |
| Gene type | protein-coding |
| Map location | 8q24.3 |
| Pascal p-value | 0.151 |
| Fetal beta | -0.135 |
| DMG | 1 (# studies) |
Gene in Data Sources
| Gene set name | Method of gene set | Description | Info |
|---|---|---|---|
| CV:PGCnp | Genome-wide Association Study | GWAS | |
| DMG:Jaffe_2016 | Genome-wide DNA methylation analysis | This dataset includes 2,104 probes/CpGs associated with SZ patients (n=108) compared to 136 controls at Bonferroni-adjusted P < 0.05. | 1 |
Section I. Genetics and epigenetics annotation
 Differentially methylated gene
| Probe | Chromosome | Position | Nearest gene | P (dis) | Beta (dis) | FDR (dis) | Study |
|---|---|---|---|---|---|---|---|
| cg01906600 | 8 | 145703049 | FOXH1 | 5.16E-9 | -0.009 | 2.91E-6 | DMG:Jaffe_2016 |
Section II. Transcriptome annotation
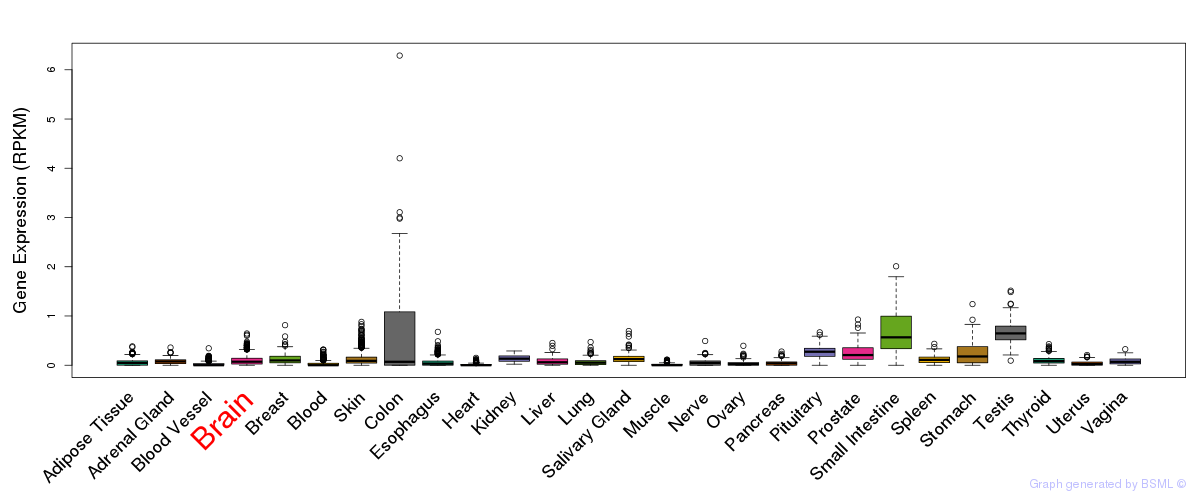
General gene expression (GTEx)
Gene expression during devlopment (BrainCloud)
Footnote:
A total of 269 time points ploted, with n=38 fetal samples (x=1:38). Each triangle represents one time point.
Gene expression of temporal and spatial changes (BrainSpan)
Footnote:
SC: sub-cortical regions; SM: sensory-motor regions; FC: frontal cortex; and TP: temporal-parietal cortex
ST1: fetal (13 - 26 postconception weeks), ST2: early infancy to late childhood (4 months to 11 years), and ST3: adolescence to adulthood (13 - 23 years)
The bar shown representes the lower 25% and upper 25% of the expression distribution.
Top co-expressed genes in brain regions
| Top 10 positively co-expressed genes | ||
| Gene | Pearson's Correlation | Spearman's Correlation |
| DOK7 | 0.62 | 0.21 |
| PPM1J | 0.61 | 0.47 |
| CPNE7 | 0.61 | 0.41 |
| PITPNM1 | 0.61 | 0.56 |
| RGS3 | 0.60 | 0.35 |
| GRID2IP | 0.59 | 0.55 |
| NTNG1 | 0.58 | 0.24 |
| C1orf127 | 0.58 | 0.16 |
| ZDHHC22 | 0.58 | 0.42 |
| GRIN2D | 0.58 | 0.60 |
| Top 10 negatively co-expressed genes | ||
| Gene | Pearson's Correlation | Spearman's Correlation |
| SPARCL1 | -0.29 | -0.34 |
| TM4SF18 | -0.29 | -0.46 |
| AF347015.31 | -0.28 | -0.45 |
| AF347015.2 | -0.26 | -0.43 |
| MT-ATP8 | -0.26 | -0.47 |
| AF347015.21 | -0.25 | -0.46 |
| AF347015.8 | -0.25 | -0.43 |
| CARD16 | -0.24 | -0.40 |
| GIMAP4 | -0.24 | -0.42 |
| AF347015.27 | -0.24 | -0.43 |
Section V. Pathway annotation
| Pathway name | Pathway size | # SZGR 2.0 genes in pathway | Info |
|---|---|---|---|
| PID SMAD2 3NUCLEAR PATHWAY | 82 | 63 | All SZGR 2.0 genes in this pathway |
| REACTOME DEVELOPMENTAL BIOLOGY | 396 | 292 | All SZGR 2.0 genes in this pathway |
| REACTOME SIGNALING BY NODAL | 18 | 11 | All SZGR 2.0 genes in this pathway |
| GRAESSMANN APOPTOSIS BY SERUM DEPRIVATION DN | 234 | 147 | All SZGR 2.0 genes in this pathway |
| RIZ ERYTHROID DIFFERENTIATION | 77 | 51 | All SZGR 2.0 genes in this pathway |
| RIZ ERYTHROID DIFFERENTIATION CCNE1 | 40 | 26 | All SZGR 2.0 genes in this pathway |
| NIKOLSKY BREAST CANCER 8Q23 Q24 AMPLICON | 157 | 87 | All SZGR 2.0 genes in this pathway |
| SU PANCREAS | 54 | 30 | All SZGR 2.0 genes in this pathway |
| IWANAGA CARCINOGENESIS BY KRAS PTEN DN | 353 | 226 | All SZGR 2.0 genes in this pathway |
| LABBE TARGETS OF TGFB1 AND WNT3A UP | 111 | 70 | All SZGR 2.0 genes in this pathway |
| MIKKELSEN ES ICP WITH H3K4ME3 | 718 | 401 | All SZGR 2.0 genes in this pathway |
| PILON KLF1 TARGETS UP | 504 | 321 | All SZGR 2.0 genes in this pathway |