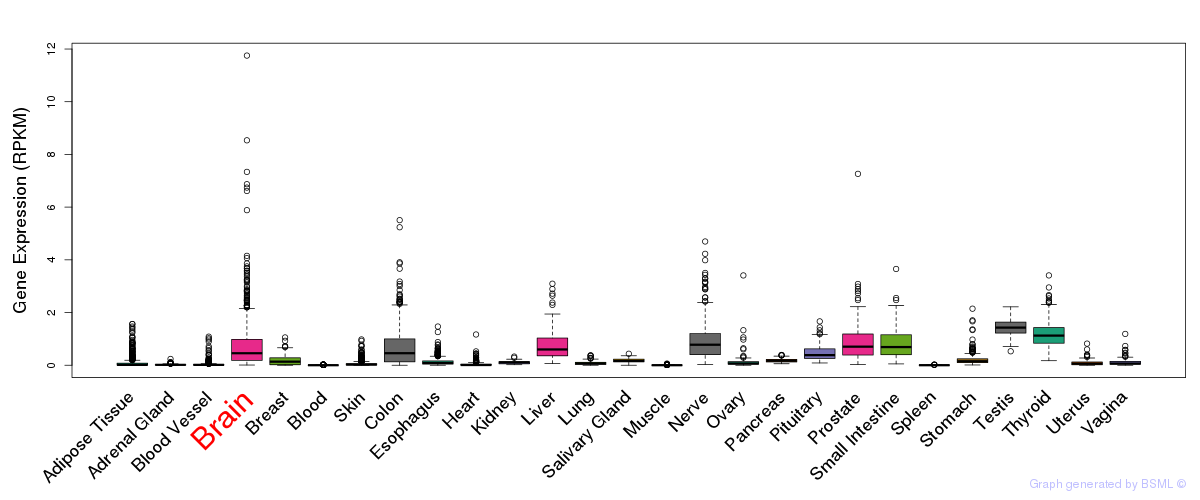
Gene Page: LRAT
Summary ?
| GeneID | 9227 |
| Symbol | LRAT |
| Synonyms | LCA14 |
| Description | lecithin retinol acyltransferase (phosphatidylcholine--retinol O-acyltransferase) |
| Reference | MIM:604863|HGNC:HGNC:6685|Ensembl:ENSG00000121207|HPRD:05332|Vega:OTTHUMG00000161418 |
| Gene type | protein-coding |
| Map location | 4q32.1 |
| Pascal p-value | 0.637 |
| Fetal beta | -0.973 |
Gene in Data Sources
| Gene set name | Method of gene set | Description | Info |
|---|---|---|---|
| CV:PGCnp | Genome-wide Association Study | GWAS | |
| CV:PheWAS | Phenome-wide association studies (PheWAS) | 157 SNPs associated with schizophrenia | 0 |
Section I. Genetics and epigenetics annotation
 CV:PheWAS
| SNP ID | Chromosome | Position | Allele | P | Function | Gene | Up/Down Distance |
|---|
Section II. Transcriptome annotation
General gene expression (GTEx)

Gene expression during devlopment (BrainCloud)
Footnote:
A total of 269 time points ploted, with n=38 fetal samples (x=1:38). Each triangle represents one time point.
Gene expression of temporal and spatial changes (BrainSpan)
Footnote:
SC: sub-cortical regions; SM: sensory-motor regions; FC: frontal cortex; and TP: temporal-parietal cortex
ST1: fetal (13 - 26 postconception weeks), ST2: early infancy to late childhood (4 months to 11 years), and ST3: adolescence to adulthood (13 - 23 years)
The bar shown representes the lower 25% and upper 25% of the expression distribution.
Top co-expressed genes in brain regions
| Top 10 positively co-expressed genes | ||
| Gene | Pearson's Correlation | Spearman's Correlation |
| ICAM5 | 0.87 | 0.86 |
| TMEM59L | 0.87 | 0.88 |
| PRKCG | 0.86 | 0.89 |
| RASAL1 | 0.84 | 0.85 |
| PRRT1 | 0.83 | 0.90 |
| IL34 | 0.83 | 0.77 |
| SYT17 | 0.83 | 0.80 |
| ARHGEF4 | 0.83 | 0.85 |
| FMNL1 | 0.82 | 0.85 |
| PLD3 | 0.82 | 0.78 |
| Top 10 negatively co-expressed genes | ||
| Gene | Pearson's Correlation | Spearman's Correlation |
| RBMX2 | -0.49 | -0.57 |
| KIAA1949 | -0.46 | -0.32 |
| CARHSP1 | -0.46 | -0.49 |
| DYNLT1 | -0.45 | -0.50 |
| IGF2BP3 | -0.45 | -0.33 |
| TMSB15A | -0.45 | -0.40 |
| TUBB2B | -0.45 | -0.42 |
| ZNF491 | -0.44 | -0.36 |
| EZH2 | -0.44 | -0.40 |
| BAZ1A | -0.44 | -0.65 |
Section V. Pathway annotation
| Pathway name | Pathway size | # SZGR 2.0 genes in pathway | Info |
|---|---|---|---|
| KEGG RETINOL METABOLISM | 64 | 37 | All SZGR 2.0 genes in this pathway |
| PID CONE PATHWAY | 23 | 8 | All SZGR 2.0 genes in this pathway |
| PID RHODOPSIN PATHWAY | 24 | 10 | All SZGR 2.0 genes in this pathway |
| REACTOME METABOLISM OF STEROID HORMONES AND VITAMINS A AND D | 35 | 23 | All SZGR 2.0 genes in this pathway |
| REACTOME METABOLISM OF LIPIDS AND LIPOPROTEINS | 478 | 302 | All SZGR 2.0 genes in this pathway |
| GAUSSMANN MLL AF4 FUSION TARGETS G UP | 238 | 135 | All SZGR 2.0 genes in this pathway |
| BENPORATH NANOG TARGETS | 988 | 594 | All SZGR 2.0 genes in this pathway |
| BENPORATH OCT4 TARGETS | 290 | 172 | All SZGR 2.0 genes in this pathway |
| BENPORATH SOX2 TARGETS | 734 | 436 | All SZGR 2.0 genes in this pathway |
| BENPORATH NOS TARGETS | 179 | 105 | All SZGR 2.0 genes in this pathway |
| BENPORATH ES WITH H3K27ME3 | 1118 | 744 | All SZGR 2.0 genes in this pathway |
| BILD HRAS ONCOGENIC SIGNATURE | 261 | 166 | All SZGR 2.0 genes in this pathway |
| MIKKELSEN NPC HCP WITH H3K27ME3 | 341 | 243 | All SZGR 2.0 genes in this pathway |
| MIKKELSEN MEF HCP WITH H3K27ME3 | 590 | 403 | All SZGR 2.0 genes in this pathway |
| FEVR CTNNB1 TARGETS DN | 553 | 343 | All SZGR 2.0 genes in this pathway |