Gene Page: CD6
Summary ?
| GeneID | 923 |
| Symbol | CD6 |
| Synonyms | TP120 |
| Description | CD6 molecule |
| Reference | MIM:186720|HGNC:HGNC:1691|Ensembl:ENSG00000013725|HPRD:01724|Vega:OTTHUMG00000167823 |
| Gene type | protein-coding |
| Map location | 11q13 |
| Pascal p-value | 0.656 |
| DMG | 1 (# studies) |
| eGene | Anterior cingulate cortex BA24 Cerebellar Hemisphere Cerebellum Cortex Frontal Cortex BA9 Hypothalamus Meta |
Gene in Data Sources
| Gene set name | Method of gene set | Description | Info |
|---|---|---|---|
| CV:PGCnp | Genome-wide Association Study | GWAS | |
| DMG:vanEijk_2014 | Genome-wide DNA methylation analysis | This dataset includes 432 differentially methylated CpG sites corresponding to 391 unique transcripts between schizophrenia patients (n=260) and unaffected controls (n=250). | 1 |
Section I. Genetics and epigenetics annotation
 Differentially methylated gene
| Probe | Chromosome | Position | Nearest gene | P (dis) | Beta (dis) | FDR (dis) | Study |
|---|---|---|---|---|---|---|---|
| cg24674703 | 11 | 60869960 | CD6 | 3.47E-6 | -5.635 | DMG:vanEijk_2014 |
eQTL annotation
| SNP ID | Chromosome | Position | eGene | Gene Entrez ID | pvalue | qvalue | TSS distance | eQTL type |
|---|---|---|---|---|---|---|---|---|
| rs11230563 | 11 | 60776209 | CD6 | ENSG00000013725.10 | 3.69797E-9 | 0 | 37094 | gtex_brain_ba24 |
| rs2074227 | 11 | 60776781 | CD6 | ENSG00000013725.10 | 3.74396E-9 | 0 | 37666 | gtex_brain_ba24 |
Section II. Transcriptome annotation
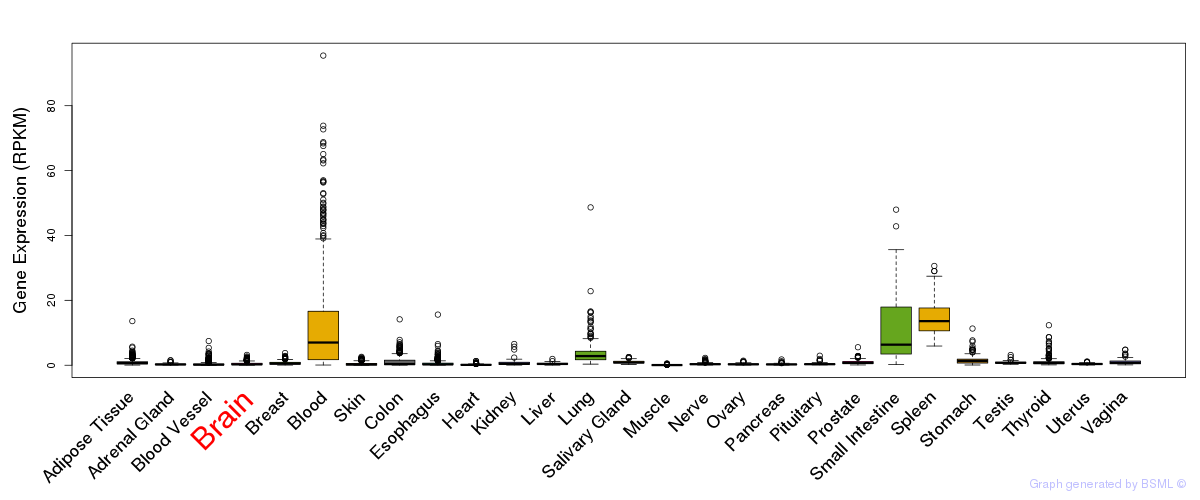
General gene expression (GTEx)
Gene expression during devlopment (BrainCloud)
Footnote:
A total of 269 time points ploted, with n=38 fetal samples (x=1:38). Each triangle represents one time point.
Gene expression of temporal and spatial changes (BrainSpan)
Footnote:
SC: sub-cortical regions; SM: sensory-motor regions; FC: frontal cortex; and TP: temporal-parietal cortex
ST1: fetal (13 - 26 postconception weeks), ST2: early infancy to late childhood (4 months to 11 years), and ST3: adolescence to adulthood (13 - 23 years)
The bar shown representes the lower 25% and upper 25% of the expression distribution.
Top co-expressed genes in brain regions
| Top 10 positively co-expressed genes | ||
| Gene | Pearson's Correlation | Spearman's Correlation |
| CA2 | 0.90 | 0.93 |
| CBR1 | 0.90 | 0.90 |
| MAL | 0.89 | 0.91 |
| APOD | 0.88 | 0.93 |
| PLLP | 0.88 | 0.92 |
| CYP27A1 | 0.87 | 0.91 |
| CMTM5 | 0.86 | 0.92 |
| DBNDD2 | 0.86 | 0.88 |
| EVI2A | 0.86 | 0.90 |
| CRYAB | 0.85 | 0.91 |
| Top 10 negatively co-expressed genes | ||
| Gene | Pearson's Correlation | Spearman's Correlation |
| KIAA1949 | -0.70 | -0.72 |
| NKIRAS2 | -0.70 | -0.71 |
| TUBB2B | -0.69 | -0.74 |
| ZNF821 | -0.69 | -0.71 |
| MPP3 | -0.69 | -0.70 |
| CRMP1 | -0.68 | -0.71 |
| ZNF551 | -0.68 | -0.72 |
| GMIP | -0.68 | -0.71 |
| AC004017.1 | -0.68 | -0.72 |
| PCDHB18 | -0.67 | -0.72 |
Section V. Pathway annotation
| Pathway name | Pathway size | # SZGR 2.0 genes in pathway | Info |
|---|---|---|---|
| KEGG CELL ADHESION MOLECULES CAMS | 134 | 93 | All SZGR 2.0 genes in this pathway |
| PICCALUGA ANGIOIMMUNOBLASTIC LYMPHOMA DN | 136 | 86 | All SZGR 2.0 genes in this pathway |
| ZHOU INFLAMMATORY RESPONSE LIVE DN | 384 | 220 | All SZGR 2.0 genes in this pathway |
| HUTTMANN B CLL POOR SURVIVAL UP | 276 | 187 | All SZGR 2.0 genes in this pathway |
| BORCZUK MALIGNANT MESOTHELIOMA DN | 104 | 59 | All SZGR 2.0 genes in this pathway |
| SHANK TAL1 TARGETS DN | 10 | 6 | All SZGR 2.0 genes in this pathway |
| NIKOLSKY BREAST CANCER 11Q12 Q14 AMPLICON | 158 | 93 | All SZGR 2.0 genes in this pathway |
| CHESLER BRAIN QTL CIS | 75 | 51 | All SZGR 2.0 genes in this pathway |
| FERRANDO TAL1 NEIGHBORS | 21 | 15 | All SZGR 2.0 genes in this pathway |
| PENG LEUCINE DEPRIVATION UP | 142 | 93 | All SZGR 2.0 genes in this pathway |
| SANSOM APC TARGETS DN | 366 | 238 | All SZGR 2.0 genes in this pathway |
| KUMAR TARGETS OF MLL AF9 FUSION | 405 | 264 | All SZGR 2.0 genes in this pathway |
| NATSUME RESPONSE TO INTERFERON BETA DN | 52 | 33 | All SZGR 2.0 genes in this pathway |
| MOREIRA RESPONSE TO TSA UP | 28 | 23 | All SZGR 2.0 genes in this pathway |
| MCCABE BOUND BY HOXC6 | 469 | 239 | All SZGR 2.0 genes in this pathway |
| MCCABE HOXC6 TARGETS CANCER UP | 31 | 23 | All SZGR 2.0 genes in this pathway |
| SMID BREAST CANCER NORMAL LIKE UP | 476 | 285 | All SZGR 2.0 genes in this pathway |
| POOLA INVASIVE BREAST CANCER UP | 288 | 168 | All SZGR 2.0 genes in this pathway |
| LI INDUCED T TO NATURAL KILLER DN | 116 | 83 | All SZGR 2.0 genes in this pathway |
| WANG TNF TARGETS | 24 | 17 | All SZGR 2.0 genes in this pathway |
| KASLER HDAC7 TARGETS 1 UP | 194 | 133 | All SZGR 2.0 genes in this pathway |