Gene Page: FAM189A2
Summary ?
| GeneID | 9413 |
| Symbol | FAM189A2 |
| Synonyms | C9orf61|X123 |
| Description | family with sequence similarity 189 member A2 |
| Reference | MIM:607710|HGNC:HGNC:24820|Ensembl:ENSG00000135063|HPRD:16255|Vega:OTTHUMG00000019979 |
| Gene type | protein-coding |
| Map location | 9q21.11 |
| Pascal p-value | 0.012 |
| Sherlock p-value | 0.559 |
| Fetal beta | -1.941 |
| eGene | Myers' cis & trans |
Gene in Data Sources
| Gene set name | Method of gene set | Description | Info |
|---|---|---|---|
| CV:PGCnp | Genome-wide Association Study | GWAS | |
| DNM:Guipponi_2014 | Whole Exome Sequencing analysis | 49 DNMs were identified by comparing the exome of 53 individuals with sporadic SCZ and of their non-affected parents |
Section I. Genetics and epigenetics annotation
 DNM table
| Gene | Chromosome | Position | Ref | Alt | Transcript | AA change | Mutation type | Sift | CG46 | Trait | Study |
|---|---|---|---|---|---|---|---|---|---|---|---|
| FAM189A2 | C | T | NM_001127608 | p.P160S | missense | 0.09 | 1 | Schizophrenia | DNM:Guipponi_2014 |
eQTL annotation
| SNP ID | Chromosome | Position | eGene | Gene Entrez ID | pvalue | qvalue | TSS distance | eQTL type |
|---|---|---|---|---|---|---|---|---|
| rs2059867 | chr5 | 31765789 | FAM189A2 | 9413 | 0.18 | trans | ||
| rs17111364 | chr10 | 97901813 | FAM189A2 | 9413 | 0.01 | trans | ||
| rs1344430 | chr20 | 60099390 | FAM189A2 | 9413 | 0.03 | trans | ||
| rs7888404 | chrX | 20508308 | FAM189A2 | 9413 | 0.13 | trans |
Section II. Transcriptome annotation
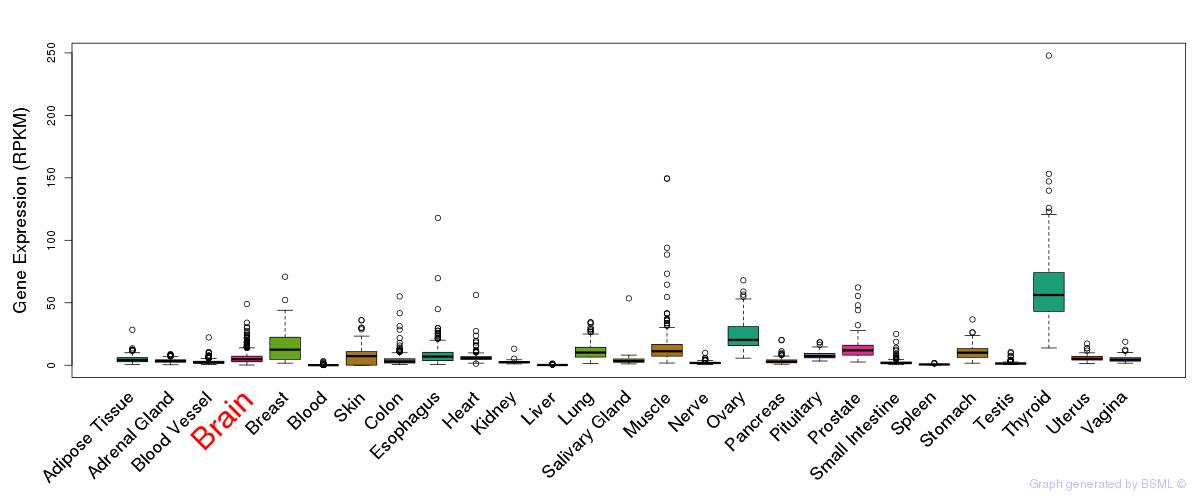
General gene expression (GTEx)
Gene expression during devlopment (BrainCloud)
Footnote:
A total of 269 time points ploted, with n=38 fetal samples (x=1:38). Each triangle represents one time point.
Gene expression of temporal and spatial changes (BrainSpan)
Footnote:
SC: sub-cortical regions; SM: sensory-motor regions; FC: frontal cortex; and TP: temporal-parietal cortex
ST1: fetal (13 - 26 postconception weeks), ST2: early infancy to late childhood (4 months to 11 years), and ST3: adolescence to adulthood (13 - 23 years)
The bar shown representes the lower 25% and upper 25% of the expression distribution.
Top co-expressed genes in brain regions
| Top 10 positively co-expressed genes | ||
| Gene | Pearson's Correlation | Spearman's Correlation |
| AC026691.1 | 0.98 | 0.97 |
| TRA2B | 0.95 | 0.93 |
| TH1L | 0.95 | 0.90 |
| USP39 | 0.95 | 0.94 |
| BUB3 | 0.94 | 0.94 |
| SFRS7 | 0.94 | 0.93 |
| HNRNPL | 0.94 | 0.95 |
| UBE2I | 0.94 | 0.93 |
| LRRC42 | 0.94 | 0.91 |
| SSRP1 | 0.94 | 0.93 |
| Top 10 negatively co-expressed genes | ||
| Gene | Pearson's Correlation | Spearman's Correlation |
| MT-CO2 | -0.75 | -0.89 |
| AF347015.27 | -0.75 | -0.89 |
| AF347015.33 | -0.74 | -0.88 |
| AF347015.31 | -0.74 | -0.87 |
| AF347015.8 | -0.74 | -0.91 |
| MT-CYB | -0.73 | -0.88 |
| AF347015.15 | -0.72 | -0.89 |
| HLA-F | -0.70 | -0.77 |
| AF347015.2 | -0.69 | -0.88 |
| AF347015.26 | -0.69 | -0.89 |
Section V. Pathway annotation
| Pathway name | Pathway size | # SZGR 2.0 genes in pathway | Info |
|---|---|---|---|
| TURASHVILI BREAST DUCTAL CARCINOMA VS DUCTAL NORMAL DN | 198 | 110 | All SZGR 2.0 genes in this pathway |
| GOZGIT ESR1 TARGETS DN | 781 | 465 | All SZGR 2.0 genes in this pathway |
| GAUSSMANN MLL AF4 FUSION TARGETS G UP | 238 | 135 | All SZGR 2.0 genes in this pathway |
| BUYTAERT PHOTODYNAMIC THERAPY STRESS UP | 811 | 508 | All SZGR 2.0 genes in this pathway |
| GEORGES TARGETS OF MIR192 AND MIR215 | 893 | 528 | All SZGR 2.0 genes in this pathway |
| WANG PROSTATE CANCER ANDROGEN INDEPENDENT | 66 | 37 | All SZGR 2.0 genes in this pathway |
| IIZUKA LIVER CANCER PROGRESSION L0 L1 UP | 17 | 12 | All SZGR 2.0 genes in this pathway |
| MOREAUX MULTIPLE MYELOMA BY TACI UP | 412 | 249 | All SZGR 2.0 genes in this pathway |
| YAMAZAKI TCEB3 TARGETS UP | 175 | 116 | All SZGR 2.0 genes in this pathway |
| BLALOCK ALZHEIMERS DISEASE UP | 1691 | 1088 | All SZGR 2.0 genes in this pathway |
| CUI TCF21 TARGETS 2 UP | 428 | 266 | All SZGR 2.0 genes in this pathway |
| JIANG HYPOXIA NORMAL | 311 | 205 | All SZGR 2.0 genes in this pathway |
| CREIGHTON ENDOCRINE THERAPY RESISTANCE 1 | 528 | 324 | All SZGR 2.0 genes in this pathway |
| RIZKI TUMOR INVASIVENESS 3D UP | 210 | 124 | All SZGR 2.0 genes in this pathway |
| ACEVEDO LIVER CANCER WITH H3K27ME3 UP | 295 | 149 | All SZGR 2.0 genes in this pathway |
| CAIRO HEPATOBLASTOMA CLASSES DN | 210 | 141 | All SZGR 2.0 genes in this pathway |
| LEE BMP2 TARGETS UP | 745 | 475 | All SZGR 2.0 genes in this pathway |
| GOBERT OLIGODENDROCYTE DIFFERENTIATION DN | 1080 | 713 | All SZGR 2.0 genes in this pathway |
| FORTSCHEGGER PHF8 TARGETS DN | 784 | 464 | All SZGR 2.0 genes in this pathway |