Gene Page: IPO13
Summary ?
| GeneID | 9670 |
| Symbol | IPO13 |
| Synonyms | IMP13|KAP13|LGL2|RANBP13 |
| Description | importin 13 |
| Reference | MIM:610411|HGNC:HGNC:16853|Ensembl:ENSG00000117408|HPRD:13742|Vega:OTTHUMG00000008297 |
| Gene type | protein-coding |
| Map location | 1p34.1 |
| Pascal p-value | 3.643E-4 |
| Sherlock p-value | 0.401 |
| Fetal beta | -0.586 |
| DMG | 1 (# studies) |
| eGene | Myers' cis & trans |
| Support | CompositeSet Darnell FMRP targets Ascano FMRP targets |
Gene in Data Sources
| Gene set name | Method of gene set | Description | Info |
|---|---|---|---|
| CV:PGCnp | Genome-wide Association Study | GWAS | |
| DMG:vanEijk_2014 | Genome-wide DNA methylation analysis | This dataset includes 432 differentially methylated CpG sites corresponding to 391 unique transcripts between schizophrenia patients (n=260) and unaffected controls (n=250). | 1 |
Section I. Genetics and epigenetics annotation
 Differentially methylated gene
| Probe | Chromosome | Position | Nearest gene | P (dis) | Beta (dis) | FDR (dis) | Study |
|---|---|---|---|---|---|---|---|
| cg18202456 | 1 | 44584930 | IPO13 | 3.486E-4 | -4.414 | DMG:vanEijk_2014 |
eQTL annotation
| SNP ID | Chromosome | Position | eGene | Gene Entrez ID | pvalue | qvalue | TSS distance | eQTL type |
|---|---|---|---|---|---|---|---|---|
| rs1879090 | chr3 | 155394480 | IPO13 | 9670 | 0.15 | trans |
Section II. Transcriptome annotation
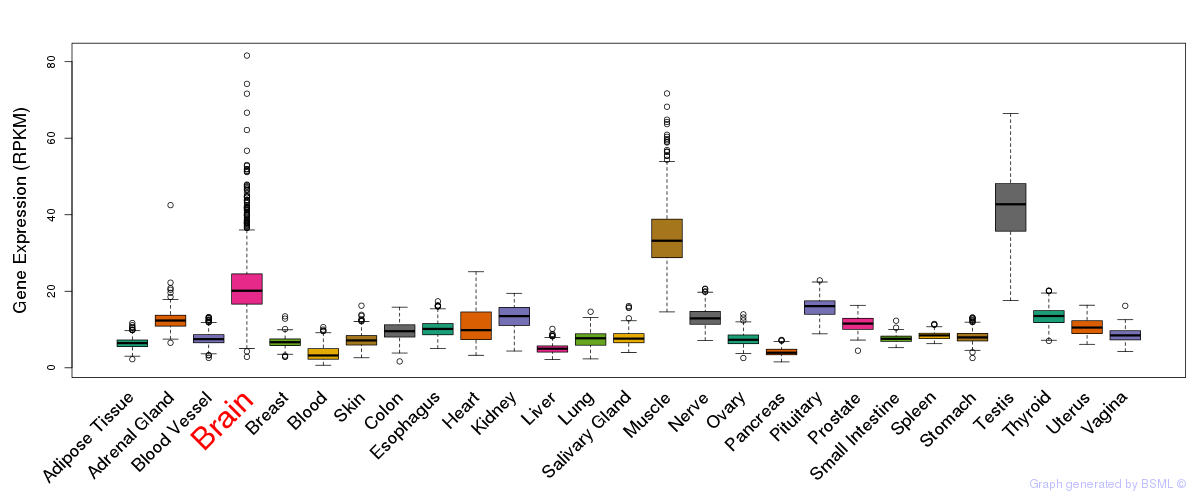
General gene expression (GTEx)
Gene expression during devlopment (BrainCloud)
Footnote:
A total of 269 time points ploted, with n=38 fetal samples (x=1:38). Each triangle represents one time point.
Gene expression of temporal and spatial changes (BrainSpan)
Footnote:
SC: sub-cortical regions; SM: sensory-motor regions; FC: frontal cortex; and TP: temporal-parietal cortex
ST1: fetal (13 - 26 postconception weeks), ST2: early infancy to late childhood (4 months to 11 years), and ST3: adolescence to adulthood (13 - 23 years)
The bar shown representes the lower 25% and upper 25% of the expression distribution.
Top co-expressed genes in brain regions
| Top 10 positively co-expressed genes | ||
| Gene | Pearson's Correlation | Spearman's Correlation |
| WDR85 | 0.90 | 0.88 |
| CDK5RAP3 | 0.90 | 0.89 |
| ANKS3 | 0.89 | 0.90 |
| CEP164 | 0.89 | 0.87 |
| CHTF18 | 0.89 | 0.91 |
| SFRS8 | 0.89 | 0.90 |
| RBM5 | 0.88 | 0.88 |
| ANKRD10 | 0.88 | 0.88 |
| TUBGCP6 | 0.88 | 0.91 |
| TRPV1 | 0.88 | 0.89 |
| Top 10 negatively co-expressed genes | ||
| Gene | Pearson's Correlation | Spearman's Correlation |
| AF347015.31 | -0.65 | -0.73 |
| AF347015.27 | -0.63 | -0.71 |
| MT-CO2 | -0.62 | -0.70 |
| AF347015.21 | -0.60 | -0.78 |
| MT-CYB | -0.60 | -0.68 |
| AF347015.8 | -0.59 | -0.69 |
| AF347015.33 | -0.59 | -0.66 |
| COPZ2 | -0.58 | -0.66 |
| AF347015.15 | -0.57 | -0.66 |
| IFI27 | -0.57 | -0.65 |
Section V. Pathway annotation
| Pathway name | Pathway size | # SZGR 2.0 genes in pathway | Info |
|---|---|---|---|
| LASTOWSKA NEUROBLASTOMA COPY NUMBER DN | 800 | 473 | All SZGR 2.0 genes in this pathway |
| DAIRKEE TERT TARGETS UP | 380 | 213 | All SZGR 2.0 genes in this pathway |
| ZHANG TARGETS OF EWSR1 FLI1 FUSION | 88 | 68 | All SZGR 2.0 genes in this pathway |
| KAAB HEART ATRIUM VS VENTRICLE DN | 261 | 183 | All SZGR 2.0 genes in this pathway |
| CUI TCF21 TARGETS 2 UP | 428 | 266 | All SZGR 2.0 genes in this pathway |
| DEBIASI APOPTOSIS BY REOVIRUS INFECTION DN | 287 | 208 | All SZGR 2.0 genes in this pathway |
| BROWNE HCMV INFECTION 24HR UP | 148 | 96 | All SZGR 2.0 genes in this pathway |
| IWANAGA CARCINOGENESIS BY KRAS PTEN UP | 181 | 112 | All SZGR 2.0 genes in this pathway |
| KUMAR PATHOGEN LOAD BY MACROPHAGES | 275 | 155 | All SZGR 2.0 genes in this pathway |