Gene Page: PCDHGA8
Summary ?
| GeneID | 9708 |
| Symbol | PCDHGA8 |
| Synonyms | PCDH-GAMMA-A8 |
| Description | protocadherin gamma subfamily A, 8 |
| Reference | MIM:606295|HGNC:HGNC:8706|Ensembl:ENSG00000253767|HPRD:09385|Vega:OTTHUMG00000164053 |
| Gene type | protein-coding |
| Map location | 5q31 |
| Fetal beta | 1.876 |
Gene in Data Sources
| Gene set name | Method of gene set | Description | Info |
|---|---|---|---|
| CV:PGCnp | Genome-wide Association Study | GWAS | |
| DMG:Wockner_2014 | Genome-wide DNA methylation analysis | This dataset includes 4641 differentially methylated probes corresponding to 2929 unique genes between schizophrenia patients (n=24) and controls (n=24). | 0 |
| PMID:cooccur | High-throughput literature-search | Systematic search in PubMed for genes co-occurring with SCZ keywords. A total of 3027 genes were included. | |
| GSMA_I | Genome scan meta-analysis | Psr: 0.0032 | |
| Literature | High-throughput literature-search | Co-occurance with Schizophrenia keywords: schizophrenia,schizophrenic,schizophrenias | Click to show details |
Section I. Genetics and epigenetics annotation
 Differentially methylated gene
| Probe | Chromosome | Position | Nearest gene | P (dis) | Beta (dis) | FDR (dis) | Study |
|---|
Section II. Transcriptome annotation
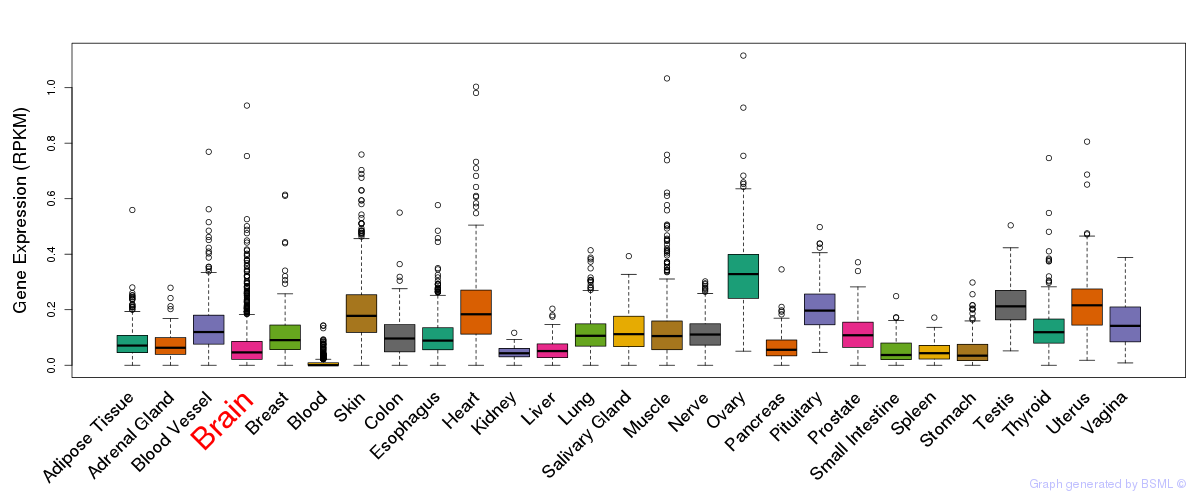
General gene expression (GTEx)
Gene expression during devlopment (BrainCloud)
Footnote:
A total of 269 time points ploted, with n=38 fetal samples (x=1:38). Each triangle represents one time point.
Gene expression of temporal and spatial changes (BrainSpan)
Footnote:
SC: sub-cortical regions; SM: sensory-motor regions; FC: frontal cortex; and TP: temporal-parietal cortex
ST1: fetal (13 - 26 postconception weeks), ST2: early infancy to late childhood (4 months to 11 years), and ST3: adolescence to adulthood (13 - 23 years)
The bar shown representes the lower 25% and upper 25% of the expression distribution.
Top co-expressed genes in brain regions
| Top 10 positively co-expressed genes | ||
| Gene | Pearson's Correlation | Spearman's Correlation |
| SPAST | 0.97 | 0.97 |
| HMG20A | 0.96 | 0.97 |
| PHF20 | 0.96 | 0.97 |
| ZNF148 | 0.96 | 0.97 |
| RSBN1 | 0.96 | 0.97 |
| PPP2R5E | 0.96 | 0.96 |
| GTF3C4 | 0.96 | 0.97 |
| POLR3A | 0.96 | 0.97 |
| ZNF776 | 0.96 | 0.95 |
| WDR82 | 0.96 | 0.96 |
| Top 10 negatively co-expressed genes | ||
| Gene | Pearson's Correlation | Spearman's Correlation |
| AF347015.31 | -0.74 | -0.88 |
| MT-CO2 | -0.74 | -0.89 |
| FXYD1 | -0.73 | -0.86 |
| HSD17B14 | -0.72 | -0.79 |
| IFI27 | -0.71 | -0.85 |
| MT-CYB | -0.71 | -0.84 |
| AF347015.27 | -0.71 | -0.84 |
| AF347015.33 | -0.71 | -0.83 |
| HIGD1B | -0.71 | -0.86 |
| AF347015.8 | -0.70 | -0.87 |
Section III. Gene Ontology annotation
| Molecular function | GO term | Evidence | Neuro keywords | PubMed ID |
|---|---|---|---|---|
| GO:0005509 | calcium ion binding | IEA | - | |
| GO:0005515 | protein binding | IEA | - | |
| Biological process | GO term | Evidence | Neuro keywords | PubMed ID |
| GO:0007155 | cell adhesion | IEA | - | |
| GO:0007156 | homophilic cell adhesion | IEA | - | |
| Cellular component | GO term | Evidence | Neuro keywords | PubMed ID |
| GO:0016021 | integral to membrane | IEA | - | |
| GO:0005886 | plasma membrane | IEA | - |
Section V. Pathway annotation
| Pathway name | Pathway size | # SZGR 2.0 genes in pathway | Info |
|---|---|---|---|
| THUM SYSTOLIC HEART FAILURE DN | 244 | 147 | All SZGR 2.0 genes in this pathway |
| NAGASHIMA NRG1 SIGNALING DN | 58 | 35 | All SZGR 2.0 genes in this pathway |
| ACEVEDO LIVER CANCER WITH H3K27ME3 DN | 228 | 114 | All SZGR 2.0 genes in this pathway |
| CROONQUIST IL6 DEPRIVATION UP | 20 | 10 | All SZGR 2.0 genes in this pathway |
| FIGUEROA AML METHYLATION CLUSTER 3 UP | 170 | 97 | All SZGR 2.0 genes in this pathway |
| JOHNSTONE PARVB TARGETS 3 DN | 918 | 550 | All SZGR 2.0 genes in this pathway |
Section VI. microRNA annotation
| miRNA family | Target position | miRNA ID | miRNA seq | ||
|---|---|---|---|---|---|
| UTR start | UTR end | Match method | |||
| miR-133 | 1194 | 1201 | 1A,m8 | hsa-miR-133a | UUGGUCCCCUUCAACCAGCUGU |
| hsa-miR-133b | UUGGUCCCCUUCAACCAGCUA | ||||
| miR-135 | 903 | 909 | 1A | hsa-miR-135a | UAUGGCUUUUUAUUCCUAUGUGA |
| hsa-miR-135b | UAUGGCUUUUCAUUCCUAUGUG | ||||
| miR-153 | 191 | 197 | 1A | hsa-miR-153 | UUGCAUAGUCACAAAAGUGA |
| miR-448 | 190 | 197 | 1A,m8 | hsa-miR-448 | UUGCAUAUGUAGGAUGUCCCAU |
| miR-7 | 317 | 323 | 1A | hsa-miR-7SZ | UGGAAGACUAGUGAUUUUGUUG |
- SZ: miRNAs which differentially expressed in brain cortex of schizophrenia patients comparing with control samples using microarray. Click here to see the list of SZ related miRNAs.
- Brain: miRNAs which are expressed in brain based on miRNA microarray expression studies. Click here to see the list of brain related miRNAs.