Gene Page: TATDN2
Summary ?
| GeneID | 9797 |
| Symbol | TATDN2 |
| Synonyms | - |
| Description | TatD DNase domain containing 2 |
| Reference | HGNC:HGNC:28988|Ensembl:ENSG00000157014|HPRD:18712|Vega:OTTHUMG00000155361 |
| Gene type | protein-coding |
| Map location | 3p25.3 |
| Pascal p-value | 0.559 |
| Sherlock p-value | 0.326 |
| Fetal beta | 0.055 |
| DMG | 2 (# studies) |
| eGene | Myers' cis & trans Meta |
Gene in Data Sources
| Gene set name | Method of gene set | Description | Info |
|---|---|---|---|
| CV:PGCnp | Genome-wide Association Study | GWAS | |
| DMG:Jaffe_2016 | Genome-wide DNA methylation analysis | This dataset includes 2,104 probes/CpGs associated with SZ patients (n=108) compared to 136 controls at Bonferroni-adjusted P < 0.05. | 2 |
| DMG:Wockner_2014 | Genome-wide DNA methylation analysis | This dataset includes 4641 differentially methylated probes corresponding to 2929 unique genes between schizophrenia patients (n=24) and controls (n=24). | 2 |
Section I. Genetics and epigenetics annotation
 Differentially methylated gene
| Probe | Chromosome | Position | Nearest gene | P (dis) | Beta (dis) | FDR (dis) | Study |
|---|---|---|---|---|---|---|---|
| cg15334456 | 3 | 10290272 | TATDN2 | 3.392E-4 | -0.228 | 0.041 | DMG:Wockner_2014 |
| cg21376738 | 3 | 10289910 | TATDN2 | 1.4E-8 | -0.009 | 5.45E-6 | DMG:Jaffe_2016 |
eQTL annotation
| SNP ID | Chromosome | Position | eGene | Gene Entrez ID | pvalue | qvalue | TSS distance | eQTL type |
|---|---|---|---|---|---|---|---|---|
| rs16836102 | chr4 | 4716366 | TATDN2 | 9797 | 0.05 | trans |
Section II. Transcriptome annotation
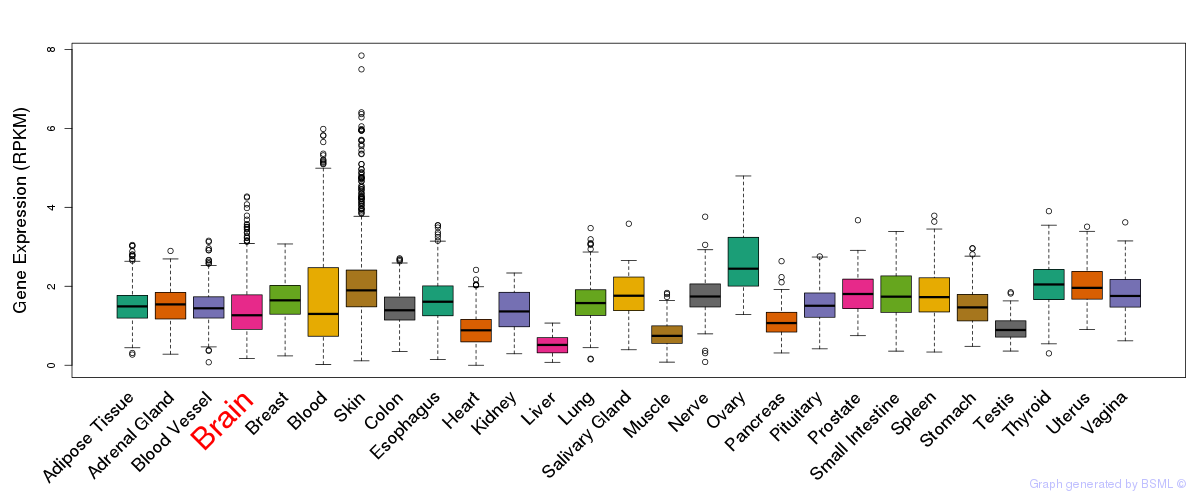
General gene expression (GTEx)
Gene expression during devlopment (BrainCloud)
Footnote:
A total of 269 time points ploted, with n=38 fetal samples (x=1:38). Each triangle represents one time point.
Gene expression of temporal and spatial changes (BrainSpan)
Footnote:
SC: sub-cortical regions; SM: sensory-motor regions; FC: frontal cortex; and TP: temporal-parietal cortex
ST1: fetal (13 - 26 postconception weeks), ST2: early infancy to late childhood (4 months to 11 years), and ST3: adolescence to adulthood (13 - 23 years)
The bar shown representes the lower 25% and upper 25% of the expression distribution.
Top co-expressed genes in brain regions
| Top 10 positively co-expressed genes | ||
| Gene | Pearson's Correlation | Spearman's Correlation |
| LARS | 0.86 | 0.87 |
| YME1L1 | 0.86 | 0.88 |
| GTPBP4 | 0.86 | 0.88 |
| PLAA | 0.86 | 0.87 |
| GPBP1 | 0.86 | 0.87 |
| PEX13 | 0.85 | 0.88 |
| CDC5L | 0.85 | 0.88 |
| NRD1 | 0.85 | 0.84 |
| C1orf149 | 0.85 | 0.88 |
| STRBP | 0.85 | 0.87 |
| Top 10 negatively co-expressed genes | ||
| Gene | Pearson's Correlation | Spearman's Correlation |
| MT-CO2 | -0.79 | -0.83 |
| AF347015.31 | -0.77 | -0.82 |
| AF347015.33 | -0.77 | -0.81 |
| MT-CYB | -0.76 | -0.81 |
| AF347015.8 | -0.76 | -0.81 |
| AF347015.27 | -0.75 | -0.79 |
| IFI27 | -0.75 | -0.82 |
| FXYD1 | -0.75 | -0.82 |
| HIGD1B | -0.74 | -0.80 |
| AF347015.2 | -0.74 | -0.82 |
Section V. Pathway annotation
| Pathway name | Pathway size | # SZGR 2.0 genes in pathway | Info |
|---|---|---|---|
| REACTOME DIABETES PATHWAYS | 133 | 91 | All SZGR 2.0 genes in this pathway |
| REACTOME ACTIVATION OF CHAPERONE GENES BY XBP1S | 46 | 34 | All SZGR 2.0 genes in this pathway |
| REACTOME UNFOLDED PROTEIN RESPONSE | 80 | 51 | All SZGR 2.0 genes in this pathway |
| LASTOWSKA NEUROBLASTOMA COPY NUMBER DN | 800 | 473 | All SZGR 2.0 genes in this pathway |
| MOHANKUMAR TLX1 TARGETS UP | 414 | 287 | All SZGR 2.0 genes in this pathway |
| PUJANA BRCA1 PCC NETWORK | 1652 | 1023 | All SZGR 2.0 genes in this pathway |
| PUJANA CHEK2 PCC NETWORK | 779 | 480 | All SZGR 2.0 genes in this pathway |
| PENG RAPAMYCIN RESPONSE DN | 245 | 154 | All SZGR 2.0 genes in this pathway |
| JAZAERI BREAST CANCER BRCA1 VS BRCA2 UP | 49 | 28 | All SZGR 2.0 genes in this pathway |
| DURCHDEWALD SKIN CARCINOGENESIS DN | 264 | 168 | All SZGR 2.0 genes in this pathway |
| YOSHIMURA MAPK8 TARGETS DN | 366 | 257 | All SZGR 2.0 genes in this pathway |
| KIM ALL DISORDERS OLIGODENDROCYTE NUMBER CORR UP | 756 | 494 | All SZGR 2.0 genes in this pathway |
| PLASARI TGFB1 SIGNALING VIA NFIC 1HR UP | 33 | 25 | All SZGR 2.0 genes in this pathway |
| ALFANO MYC TARGETS | 239 | 156 | All SZGR 2.0 genes in this pathway |