Gene Page: SLC38A7
Summary ?
| GeneID | 55238 |
| Symbol | SLC38A7 |
| Synonyms | SNAT7 |
| Description | solute carrier family 38 member 7 |
| Reference | MIM:614236|HGNC:HGNC:25582|Ensembl:ENSG00000103042|HPRD:07701|Vega:OTTHUMG00000133491 |
| Gene type | protein-coding |
| Map location | 16q21 |
| Pascal p-value | 1.487E-8 |
| Sherlock p-value | 0.075 |
| Fetal beta | -0.443 |
| eGene | Anterior cingulate cortex BA24 Cerebellar Hemisphere |
Gene in Data Sources
| Gene set name | Method of gene set | Description | Info |
|---|---|---|---|
| CV:GWAScat | Genome-wide Association Studies | This data set includes 560 SNPs associated with schizophrenia. A total of 486 genes were mapped to these SNPs within 50kb. | |
| CV:PGC128 | Genome-wide Association Study | A multi-stage schizophrenia GWAS of up to 36,989 cases and 113,075 controls. Reported by the Schizophrenia Working Group of PGC. 128 independent associations spanning 108 loci | |
| CV:PGCnp | Genome-wide Association Study | GWAS |
Section I. Genetics and epigenetics annotation
 CV:PGC128
| SNP ID | Chromosome | Position | Allele | P | Function | Gene | Up/Down Distance |
|---|---|---|---|---|---|---|---|
| rs12325245 | chr16 | 58681393 | AT | 1.149E-8 | intergenic | CNOT1,SLC38A7 | dist=17603;dist=17620 |
eQTL annotation
| SNP ID | Chromosome | Position | eGene | Gene Entrez ID | pvalue | qvalue | TSS distance | eQTL type |
|---|---|---|---|---|---|---|---|---|
| rs2731760 | 16 | 58289494 | SLC38A7 | ENSG00000103042.4 | 2.37236E-6 | 0.04 | 429514 | gtex_brain_ba24 |
Section II. Transcriptome annotation
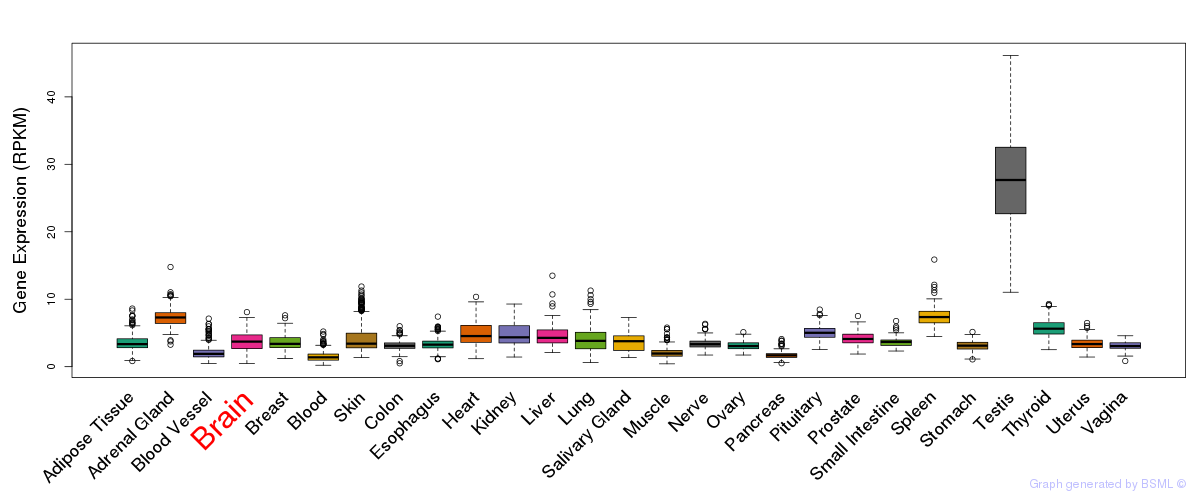
General gene expression (GTEx)
Gene expression during devlopment (BrainCloud)
Footnote:
A total of 269 time points ploted, with n=38 fetal samples (x=1:38). Each triangle represents one time point.
Gene expression of temporal and spatial changes (BrainSpan)
Footnote:
SC: sub-cortical regions; SM: sensory-motor regions; FC: frontal cortex; and TP: temporal-parietal cortex
ST1: fetal (13 - 26 postconception weeks), ST2: early infancy to late childhood (4 months to 11 years), and ST3: adolescence to adulthood (13 - 23 years)
The bar shown representes the lower 25% and upper 25% of the expression distribution.
No co-expressed genes in brain regions
Section V. Pathway annotation
| Pathway name | Pathway size | # SZGR 2.0 genes in pathway | Info |
|---|---|---|---|
| KINSEY TARGETS OF EWSR1 FLII FUSION DN | 329 | 219 | All SZGR 2.0 genes in this pathway |
| ROYLANCE BREAST CANCER 16Q COPY NUMBER UP | 63 | 44 | All SZGR 2.0 genes in this pathway |
| BUYTAERT PHOTODYNAMIC THERAPY STRESS UP | 811 | 508 | All SZGR 2.0 genes in this pathway |
| RICKMAN TUMOR DIFFERENTIATED WELL VS POORLY DN | 382 | 224 | All SZGR 2.0 genes in this pathway |
| STEIN ESRRA TARGETS UP | 388 | 234 | All SZGR 2.0 genes in this pathway |
| SHEDDEN LUNG CANCER GOOD SURVIVAL A12 | 317 | 177 | All SZGR 2.0 genes in this pathway |
| ROME INSULIN TARGETS IN MUSCLE DN | 204 | 114 | All SZGR 2.0 genes in this pathway |
| STEIN ESRRA TARGETS | 535 | 325 | All SZGR 2.0 genes in this pathway |
| MIKKELSEN ES ICP WITH H3K4ME3 | 718 | 401 | All SZGR 2.0 genes in this pathway |
| MIKKELSEN NPC ICP WITH H3K4ME3 | 445 | 257 | All SZGR 2.0 genes in this pathway |
| WAKABAYASHI ADIPOGENESIS PPARG RXRA BOUND 8D | 882 | 506 | All SZGR 2.0 genes in this pathway |