Gene Page: PPP1R13L
Summary ?
| GeneID | 10848 |
| Symbol | PPP1R13L |
| Synonyms | IASPP|NKIP1|RAI|RAI4 |
| Description | protein phosphatase 1 regulatory subunit 13 like |
| Reference | MIM:607463|HGNC:HGNC:18838|Ensembl:ENSG00000104881|HPRD:09195|Vega:OTTHUMG00000181784 |
| Gene type | protein-coding |
| Map location | 19q13.32 |
| Pascal p-value | 0.297 |
| Fetal beta | -0.323 |
| DMG | 1 (# studies) |
Gene in Data Sources
| Gene set name | Method of gene set | Description | Info |
|---|---|---|---|
| CV:PGCnp | Genome-wide Association Study | GWAS | |
| DMG:Wockner_2014 | Genome-wide DNA methylation analysis | This dataset includes 4641 differentially methylated probes corresponding to 2929 unique genes between schizophrenia patients (n=24) and controls (n=24). | 1 |
Section I. Genetics and epigenetics annotation
 DNM table
| Gene | Chromosome | Position | Ref | Alt | Transcript | AA change | Mutation type | Sift | CG46 | Trait | Study |
|---|---|---|---|---|---|---|---|---|---|---|---|
| PPP1R13L | chr19 | 45900128 | C | T | NM_001142502 NM_006663 | . . | silent silent | Schizophrenia | DNM:Fromer_2014 | ||
| PPP1R13L | chr19 | 45885917 | C | T | NM_001142502 NM_006663 | . . | silent silent | Schizophrenia | DNM:Gulsuner_2013 |
 Differentially methylated gene
| Probe | Chromosome | Position | Nearest gene | P (dis) | Beta (dis) | FDR (dis) | Study |
|---|---|---|---|---|---|---|---|
| cg07637658 | 19 | 45887042 | PPP1R13L | 1.71E-5 | 0.327 | 0.015 | DMG:Wockner_2014 |
Section II. Transcriptome annotation
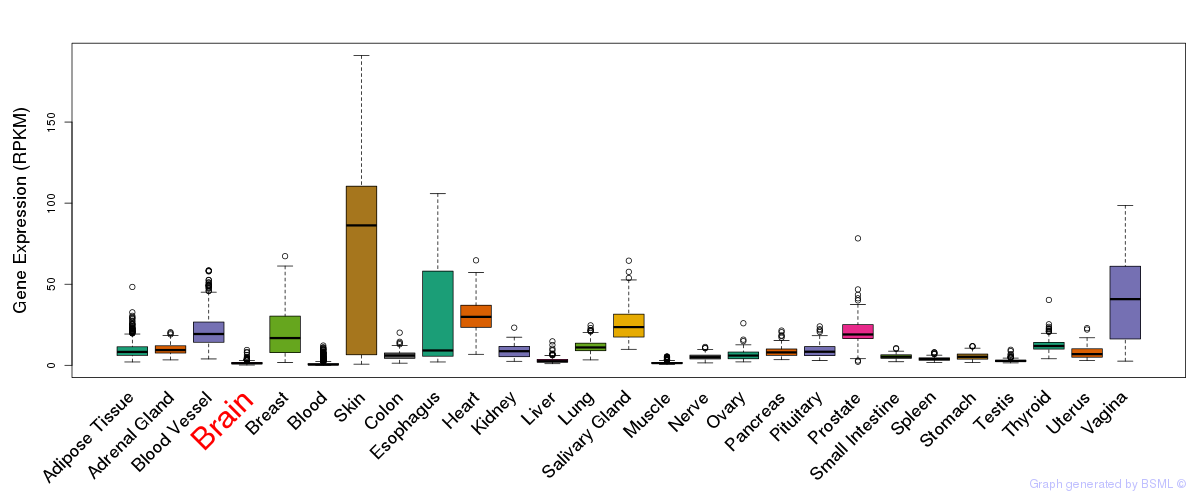
General gene expression (GTEx)

Gene expression during devlopment (BrainCloud)
Footnote:
A total of 269 time points ploted, with n=38 fetal samples (x=1:38). Each triangle represents one time point.
Gene expression of temporal and spatial changes (BrainSpan)
Footnote:
SC: sub-cortical regions; SM: sensory-motor regions; FC: frontal cortex; and TP: temporal-parietal cortex
ST1: fetal (13 - 26 postconception weeks), ST2: early infancy to late childhood (4 months to 11 years), and ST3: adolescence to adulthood (13 - 23 years)
The bar shown representes the lower 25% and upper 25% of the expression distribution.
Top co-expressed genes in brain regions
| Top 10 positively co-expressed genes | ||
| Gene | Pearson's Correlation | Spearman's Correlation |
| C3 | 0.81 | 0.80 |
| C1QC | 0.80 | 0.82 |
| ADORA3 | 0.80 | 0.80 |
| TBXAS1 | 0.78 | 0.81 |
| LAPTM5 | 0.78 | 0.80 |
| SPI1 | 0.78 | 0.78 |
| PTPN6 | 0.77 | 0.74 |
| CSF3R | 0.77 | 0.72 |
| APBB1IP | 0.77 | 0.78 |
| ITGB2 | 0.76 | 0.73 |
| Top 10 negatively co-expressed genes | ||
| Gene | Pearson's Correlation | Spearman's Correlation |
| SCUBE1 | -0.30 | -0.25 |
| DACT1 | -0.29 | -0.14 |
| MYCN | -0.29 | -0.15 |
| NEUROD6 | -0.29 | -0.17 |
| SRGAP1 | -0.29 | -0.17 |
| TMC2 | -0.29 | -0.21 |
| FAT4 | -0.29 | -0.15 |
| ZNF124 | -0.29 | -0.20 |
| AC004017.1 | -0.29 | -0.21 |
| VASH2 | -0.29 | -0.14 |
Section V. Pathway annotation
| Pathway name | Pathway size | # SZGR 2.0 genes in pathway | Info |
|---|---|---|---|
| PID P53 REGULATION PATHWAY | 59 | 50 | All SZGR 2.0 genes in this pathway |
| WANG CLIM2 TARGETS DN | 186 | 114 | All SZGR 2.0 genes in this pathway |
| DODD NASOPHARYNGEAL CARCINOMA UP | 1821 | 933 | All SZGR 2.0 genes in this pathway |
| RODRIGUES THYROID CARCINOMA DN | 77 | 52 | All SZGR 2.0 genes in this pathway |
| ROVERSI GLIOMA COPY NUMBER UP | 100 | 75 | All SZGR 2.0 genes in this pathway |
| MANALO HYPOXIA UP | 207 | 145 | All SZGR 2.0 genes in this pathway |
| BLALOCK ALZHEIMERS DISEASE INCIPIENT UP | 390 | 242 | All SZGR 2.0 genes in this pathway |
| NIELSEN LIPOSARCOMA DN | 19 | 8 | All SZGR 2.0 genes in this pathway |
| BLALOCK ALZHEIMERS DISEASE UP | 1691 | 1088 | All SZGR 2.0 genes in this pathway |
| MARSON BOUND BY E2F4 UNSTIMULATED | 728 | 415 | All SZGR 2.0 genes in this pathway |
| STEIN ESRRA TARGETS UP | 388 | 234 | All SZGR 2.0 genes in this pathway |
| ZHANG BREAST CANCER PROGENITORS DN | 145 | 93 | All SZGR 2.0 genes in this pathway |
| AGUIRRE PANCREATIC CANCER COPY NUMBER UP | 298 | 174 | All SZGR 2.0 genes in this pathway |
| STEIN ESRRA TARGETS | 535 | 325 | All SZGR 2.0 genes in this pathway |
| KOINUMA TARGETS OF SMAD2 OR SMAD3 | 824 | 528 | All SZGR 2.0 genes in this pathway |
| PURBEY TARGETS OF CTBP1 NOT SATB1 DN | 448 | 282 | All SZGR 2.0 genes in this pathway |
| PLASARI TGFB1 TARGETS 10HR UP | 199 | 143 | All SZGR 2.0 genes in this pathway |
| KRIEG HYPOXIA NOT VIA KDM3A | 770 | 480 | All SZGR 2.0 genes in this pathway |