Gene Page: IKBIP
Summary ?
| GeneID | 121457 |
| Symbol | IKBIP |
| Synonyms | IKIP |
| Description | IKBKB interacting protein |
| Reference | MIM:609861|HGNC:HGNC:26430|Ensembl:ENSG00000166130|HPRD:08092|Vega:OTTHUMG00000170213 |
| Gene type | protein-coding |
| Map location | 12q23.1 |
| Pascal p-value | 0.733 |
| Fetal beta | 1.162 |
| eGene | Cortex Hippocampus Putamen basal ganglia |
| Support | CompositeSet |
Gene in Data Sources
| Gene set name | Method of gene set | Description | Info |
|---|---|---|---|
| CV:PGCnp | Genome-wide Association Study | GWAS | |
| DMG:Wockner_2014 | Genome-wide DNA methylation analysis | This dataset includes 4641 differentially methylated probes corresponding to 2929 unique genes between schizophrenia patients (n=24) and controls (n=24). | 1 |
| DNM:Fromer_2014 | Whole Exome Sequencing analysis | This study reported a WES study of 623 schizophrenia trios, reporting DNMs using genomic DNA. |
Section I. Genetics and epigenetics annotation
 DNM table
| Gene | Chromosome | Position | Ref | Alt | Transcript | AA change | Mutation type | Sift | CG46 | Trait | Study |
|---|---|---|---|---|---|---|---|---|---|---|---|
| IKBIP | chr12 | 99008054 | C | T | NM_201612 NM_201613 | p.121R>H . | missense 3-UTR | Schizophrenia | DNM:Fromer_2014 |
Differentially methylated gene
| Probe | Chromosome | Position | Nearest gene | P (dis) | Beta (dis) | FDR (dis) | Study |
|---|---|---|---|---|---|---|---|
| cg18466108 | 12 | 99038412 | APAF1;IKBIP | 1.595E-4 | -0.227 | 0.032 | DMG:Wockner_2014 |
eQTL annotation
| SNP ID | Chromosome | Position | eGene | Gene Entrez ID | pvalue | qvalue | TSS distance | eQTL type |
|---|---|---|---|---|---|---|---|---|
| rs4564386 | 12 | 99023846 | IKBIP | ENSG00000166130.10 | 1.945E-6 | 0.03 | 15045 | gtex_brain_putamen_basal |
| rs67721403 | 12 | 99027273 | IKBIP | ENSG00000166130.10 | 1.422E-6 | 0.03 | 11618 | gtex_brain_putamen_basal |
| rs12371097 | 12 | 99029299 | IKBIP | ENSG00000166130.10 | 1.945E-6 | 0.03 | 9592 | gtex_brain_putamen_basal |
| rs201056003 | 12 | 99030691 | IKBIP | ENSG00000166130.10 | 3.271E-6 | 0.03 | 8200 | gtex_brain_putamen_basal |
| rs3217465 | 12 | 99038708 | IKBIP | ENSG00000166130.10 | 1.805E-6 | 0.03 | 183 | gtex_brain_putamen_basal |
| rs2278361 | 12 | 99043207 | IKBIP | ENSG00000166130.10 | 1.82E-6 | 0.03 | -4316 | gtex_brain_putamen_basal |
| rs34144325 | 12 | 99044920 | IKBIP | ENSG00000166130.10 | 1.823E-6 | 0.03 | -6029 | gtex_brain_putamen_basal |
| rs11109564 | 12 | 99059900 | IKBIP | ENSG00000166130.10 | 1.828E-6 | 0.03 | -21009 | gtex_brain_putamen_basal |
| rs35365649 | 12 | 99060627 | IKBIP | ENSG00000166130.10 | 1.828E-6 | 0.03 | -21736 | gtex_brain_putamen_basal |
| rs11109565 | 12 | 99060813 | IKBIP | ENSG00000166130.10 | 1.828E-6 | 0.03 | -21922 | gtex_brain_putamen_basal |
| rs7298561 | 12 | 99070843 | IKBIP | ENSG00000166130.10 | 2.505E-6 | 0.03 | -31952 | gtex_brain_putamen_basal |
| rs3815997 | 12 | 99071023 | IKBIP | ENSG00000166130.10 | 1.828E-6 | 0.03 | -32132 | gtex_brain_putamen_basal |
| rs7303874 | 12 | 99072233 | IKBIP | ENSG00000166130.10 | 2.58E-6 | 0.03 | -33342 | gtex_brain_putamen_basal |
| rs2288725 | 12 | 99085026 | IKBIP | ENSG00000166130.10 | 3.004E-6 | 0.03 | -46135 | gtex_brain_putamen_basal |
| rs2288724 | 12 | 99085027 | IKBIP | ENSG00000166130.10 | 3.004E-6 | 0.03 | -46136 | gtex_brain_putamen_basal |
| rs6538879 | 12 | 99088094 | IKBIP | ENSG00000166130.10 | 2.507E-6 | 0.03 | -49203 | gtex_brain_putamen_basal |
| rs12370618 | 12 | 99088223 | IKBIP | ENSG00000166130.10 | 1.828E-6 | 0.03 | -49332 | gtex_brain_putamen_basal |
| rs2288719 | 12 | 99097911 | IKBIP | ENSG00000166130.10 | 2.275E-6 | 0.03 | -59020 | gtex_brain_putamen_basal |
| rs7315547 | 12 | 99101441 | IKBIP | ENSG00000166130.10 | 2.741E-6 | 0.03 | -62550 | gtex_brain_putamen_basal |
Section II. Transcriptome annotation
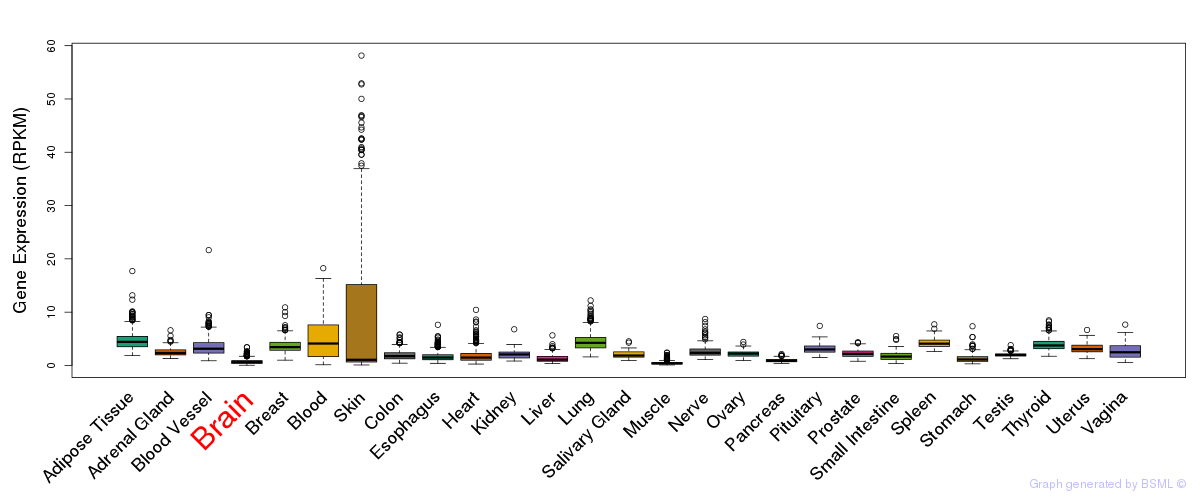
General gene expression (GTEx)
Gene expression during devlopment (BrainCloud)
Footnote:
A total of 269 time points ploted, with n=38 fetal samples (x=1:38). Each triangle represents one time point.
Gene expression of temporal and spatial changes (BrainSpan)
Footnote:
SC: sub-cortical regions; SM: sensory-motor regions; FC: frontal cortex; and TP: temporal-parietal cortex
ST1: fetal (13 - 26 postconception weeks), ST2: early infancy to late childhood (4 months to 11 years), and ST3: adolescence to adulthood (13 - 23 years)
The bar shown representes the lower 25% and upper 25% of the expression distribution.
No co-expressed genes in brain regions
Section V. Pathway annotation
| Pathway name | Pathway size | # SZGR 2.0 genes in pathway | Info |
|---|---|---|---|
| NAKAMURA TUMOR ZONE PERIPHERAL VS CENTRAL DN | 634 | 384 | All SZGR 2.0 genes in this pathway |
| SENGUPTA NASOPHARYNGEAL CARCINOMA UP | 294 | 178 | All SZGR 2.0 genes in this pathway |
| GARY CD5 TARGETS DN | 431 | 263 | All SZGR 2.0 genes in this pathway |
| CHARAFE BREAST CANCER LUMINAL VS MESENCHYMAL DN | 460 | 312 | All SZGR 2.0 genes in this pathway |
| OSMAN BLADDER CANCER DN | 406 | 230 | All SZGR 2.0 genes in this pathway |
| DODD NASOPHARYNGEAL CARCINOMA DN | 1375 | 806 | All SZGR 2.0 genes in this pathway |
| RODRIGUES THYROID CARCINOMA POORLY DIFFERENTIATED UP | 633 | 376 | All SZGR 2.0 genes in this pathway |
| COLDREN GEFITINIB RESISTANCE UP | 85 | 57 | All SZGR 2.0 genes in this pathway |
| GRAESSMANN APOPTOSIS BY DOXORUBICIN UP | 1142 | 669 | All SZGR 2.0 genes in this pathway |
| GRAESSMANN RESPONSE TO MC AND DOXORUBICIN UP | 612 | 367 | All SZGR 2.0 genes in this pathway |
| MCBRYAN PUBERTAL BREAST 4 5WK UP | 271 | 175 | All SZGR 2.0 genes in this pathway |
| DAIRKEE TERT TARGETS UP | 380 | 213 | All SZGR 2.0 genes in this pathway |
| GOTTWEIN TARGETS OF KSHV MIR K12 11 | 63 | 45 | All SZGR 2.0 genes in this pathway |
| RODWELL AGING KIDNEY UP | 487 | 303 | All SZGR 2.0 genes in this pathway |
| JIANG HYPOXIA NORMAL | 311 | 205 | All SZGR 2.0 genes in this pathway |
| KRIGE RESPONSE TO TOSEDOSTAT 6HR DN | 911 | 527 | All SZGR 2.0 genes in this pathway |
| KRIGE RESPONSE TO TOSEDOSTAT 24HR DN | 1011 | 592 | All SZGR 2.0 genes in this pathway |
| GAVIN FOXP3 TARGETS CLUSTER P3 | 160 | 103 | All SZGR 2.0 genes in this pathway |
| MARSON BOUND BY FOXP3 STIMULATED | 1022 | 619 | All SZGR 2.0 genes in this pathway |
| BRUINS UVC RESPONSE LATE | 1137 | 655 | All SZGR 2.0 genes in this pathway |
| KRIEG HYPOXIA NOT VIA KDM3A | 770 | 480 | All SZGR 2.0 genes in this pathway |