Gene Page: TC2N
Summary ?
| GeneID | 123036 |
| Symbol | TC2N |
| Synonyms | C14orf47|C2CD1|MTAC2D1|Tac2-N |
| Description | tandem C2 domains, nuclear |
| Reference | HGNC:HGNC:19859|Ensembl:ENSG00000165929|HPRD:11375|Vega:OTTHUMG00000171121 |
| Gene type | protein-coding |
| Map location | 14q32.12 |
| Pascal p-value | 0.333 |
| eGene | Anterior cingulate cortex BA24 Cortex Frontal Cortex BA9 Hypothalamus Nucleus accumbens basal ganglia |
Gene in Data Sources
| Gene set name | Method of gene set | Description | Info |
|---|---|---|---|
| CV:GWASdb | Genome-wide Association Studies | GWASdb records for schizophrenia | |
| CV:PGCnp | Genome-wide Association Study | GWAS |
Section I. Genetics and epigenetics annotation
 eQTL annotation
| SNP ID | Chromosome | Position | eGene | Gene Entrez ID | pvalue | qvalue | TSS distance | eQTL type |
|---|---|---|---|---|---|---|---|---|
| rs57035593 | 14 | 92268096 | TC2N | ENSG00000165929.8 | 3.15739E-6 | 0.04 | 65784 | gtex_brain_ba24 |
| rs10498631 | 14 | 92268531 | TC2N | ENSG00000165929.8 | 3.15739E-6 | 0.04 | 65349 | gtex_brain_ba24 |
| rs12589636 | 14 | 92287743 | TC2N | ENSG00000165929.8 | 3.15009E-6 | 0.04 | 46137 | gtex_brain_ba24 |
| rs61990092 | 14 | 92289301 | TC2N | ENSG00000165929.8 | 1.48881E-6 | 0.04 | 44579 | gtex_brain_ba24 |
| rs10498632 | 14 | 92290744 | TC2N | ENSG00000165929.8 | 3.14231E-6 | 0.04 | 43136 | gtex_brain_ba24 |
Section II. Transcriptome annotation
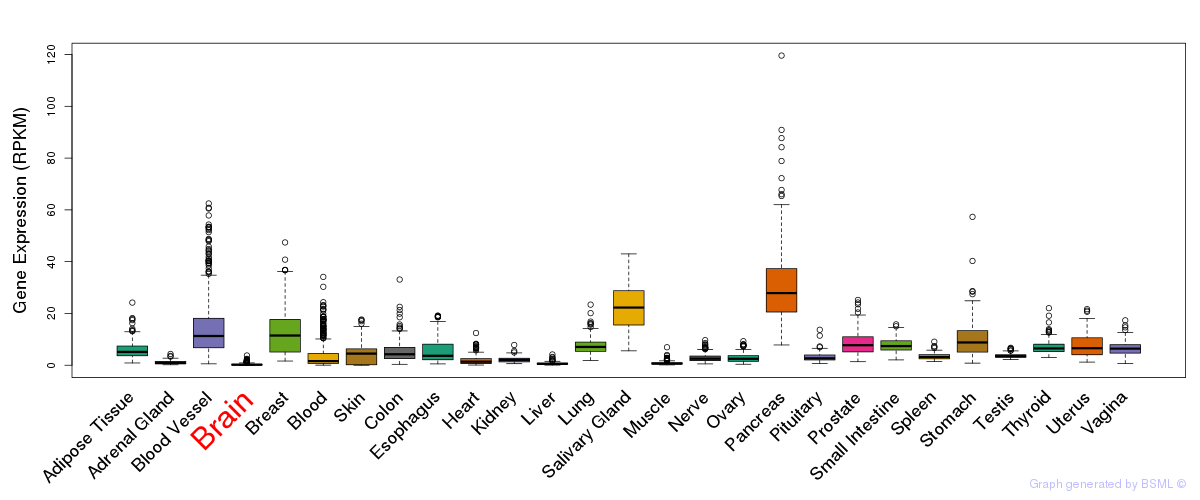
General gene expression (GTEx)
Gene expression of temporal and spatial changes (BrainSpan)
Footnote:
SC: sub-cortical regions; SM: sensory-motor regions; FC: frontal cortex; and TP: temporal-parietal cortex
ST1: fetal (13 - 26 postconception weeks), ST2: early infancy to late childhood (4 months to 11 years), and ST3: adolescence to adulthood (13 - 23 years)
The bar shown representes the lower 25% and upper 25% of the expression distribution.
Top co-expressed genes in brain regions
| Top 10 positively co-expressed genes | ||
| Gene | Pearson's Correlation | Spearman's Correlation |
| C9orf102 | 0.91 | 0.92 |
| KIAA0232 | 0.90 | 0.91 |
| TRIP12 | 0.89 | 0.90 |
| GAPVD1 | 0.89 | 0.90 |
| DNAJC13 | 0.89 | 0.90 |
| XPO4 | 0.89 | 0.90 |
| UBR2 | 0.89 | 0.90 |
| PIKFYVE | 0.89 | 0.89 |
| MYO9A | 0.89 | 0.91 |
| ERCC6 | 0.88 | 0.89 |
| Top 10 negatively co-expressed genes | ||
| Gene | Pearson's Correlation | Spearman's Correlation |
| FXYD1 | -0.70 | -0.71 |
| AF347015.21 | -0.70 | -0.73 |
| AF347015.31 | -0.68 | -0.71 |
| HIGD1B | -0.68 | -0.72 |
| MT-CO2 | -0.67 | -0.70 |
| IFI27 | -0.66 | -0.69 |
| ENHO | -0.66 | -0.73 |
| AF347015.8 | -0.65 | -0.68 |
| TLCD1 | -0.64 | -0.67 |
| AC021016.1 | -0.64 | -0.64 |
Section V. Pathway annotation
| Pathway name | Pathway size | # SZGR 2.0 genes in pathway | Info |
|---|---|---|---|
| NAKAMURA TUMOR ZONE PERIPHERAL VS CENTRAL DN | 634 | 384 | All SZGR 2.0 genes in this pathway |
| SENGUPTA NASOPHARYNGEAL CARCINOMA WITH LMP1 UP | 408 | 247 | All SZGR 2.0 genes in this pathway |
| CHARAFE BREAST CANCER LUMINAL VS BASAL UP | 380 | 215 | All SZGR 2.0 genes in this pathway |
| CHARAFE BREAST CANCER LUMINAL VS MESENCHYMAL UP | 450 | 256 | All SZGR 2.0 genes in this pathway |
| CHARAFE BREAST CANCER BASAL VS MESENCHYMAL UP | 121 | 45 | All SZGR 2.0 genes in this pathway |
| WAMUNYOKOLI OVARIAN CANCER LMP UP | 265 | 158 | All SZGR 2.0 genes in this pathway |
| GOZGIT ESR1 TARGETS DN | 781 | 465 | All SZGR 2.0 genes in this pathway |
| COLDREN GEFITINIB RESISTANCE DN | 230 | 115 | All SZGR 2.0 genes in this pathway |
| SANSOM APC TARGETS UP | 126 | 84 | All SZGR 2.0 genes in this pathway |
| MENSE HYPOXIA UP | 98 | 71 | All SZGR 2.0 genes in this pathway |
| CREIGHTON ENDOCRINE THERAPY RESISTANCE 3 | 720 | 440 | All SZGR 2.0 genes in this pathway |
| CREIGHTON ENDOCRINE THERAPY RESISTANCE 5 | 482 | 296 | All SZGR 2.0 genes in this pathway |
| SANSOM APC TARGETS | 212 | 121 | All SZGR 2.0 genes in this pathway |
| MARTINEZ RB1 TARGETS DN | 543 | 317 | All SZGR 2.0 genes in this pathway |
| MARTINEZ TP53 TARGETS DN | 593 | 372 | All SZGR 2.0 genes in this pathway |
| MARTINEZ RB1 AND TP53 TARGETS DN | 591 | 366 | All SZGR 2.0 genes in this pathway |
| BOCHKIS FOXA2 TARGETS | 425 | 261 | All SZGR 2.0 genes in this pathway |
| MEISSNER BRAIN HCP WITH H3K4ME3 AND H3K27ME3 | 1069 | 729 | All SZGR 2.0 genes in this pathway |
| ROME INSULIN TARGETS IN MUSCLE UP | 442 | 263 | All SZGR 2.0 genes in this pathway |
| MEISSNER NPC HCP WITH H3K4ME2 | 491 | 319 | All SZGR 2.0 genes in this pathway |
| MIKKELSEN MCV6 HCP WITH H3K27ME3 | 435 | 318 | All SZGR 2.0 genes in this pathway |