Gene Page: ADRB3
Summary ?
| GeneID | 155 |
| Symbol | ADRB3 |
| Synonyms | BETA3AR |
| Description | adrenoceptor beta 3 |
| Reference | MIM:109691|HGNC:HGNC:288|Ensembl:ENSG00000188778|HPRD:00188|Vega:OTTHUMG00000164028 |
| Gene type | protein-coding |
| Map location | 8p11.23 |
| Pascal p-value | 0.756 |
| Fetal beta | 0.059 |
| Support | GPCR SIGNALLING |
Gene in Data Sources
| Gene set name | Method of gene set | Description | Info |
|---|---|---|---|
| PMID:cooccur | High-throughput literature-search | Systematic search in PubMed for genes co-occurring with SCZ keywords. A total of 3027 genes were included. | |
| Literature | High-throughput literature-search | Co-occurance with Schizophrenia keywords: schizophrenia,schizophrenic,schizophrenias | Click to show details |
| GO_Annotation | Mapping neuro-related keywords to Gene Ontology annotations | Hits with neuro-related keywords: 2 |
Section I. Genetics and epigenetics annotation
Section II. Transcriptome annotation
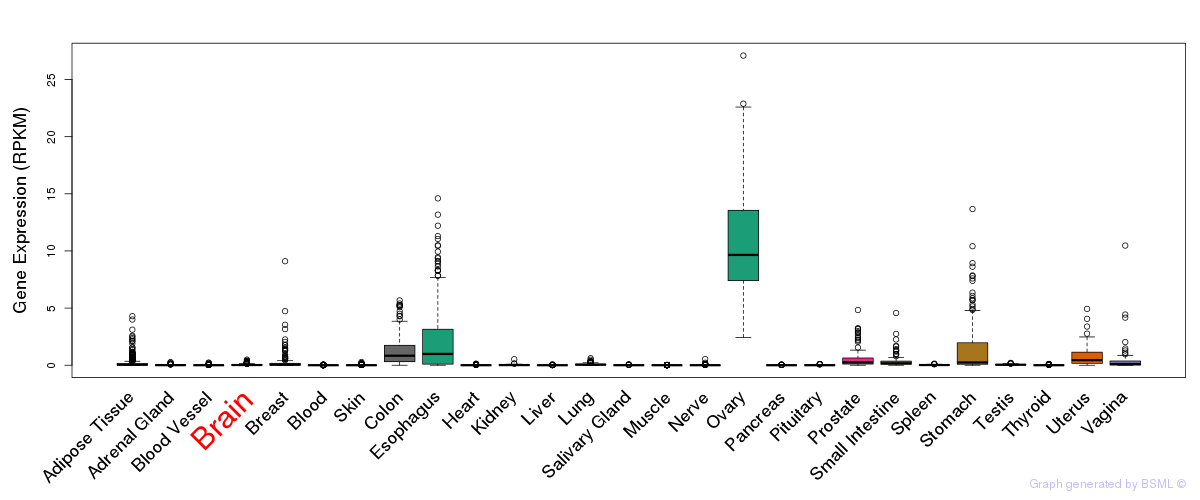
General gene expression (GTEx)
Gene expression during devlopment (BrainCloud)
Footnote:
A total of 269 time points ploted, with n=38 fetal samples (x=1:38). Each triangle represents one time point.
Gene expression of temporal and spatial changes (BrainSpan)
Footnote:
SC: sub-cortical regions; SM: sensory-motor regions; FC: frontal cortex; and TP: temporal-parietal cortex
ST1: fetal (13 - 26 postconception weeks), ST2: early infancy to late childhood (4 months to 11 years), and ST3: adolescence to adulthood (13 - 23 years)
The bar shown representes the lower 25% and upper 25% of the expression distribution.
Top co-expressed genes in brain regions
| Top 10 positively co-expressed genes | ||
| Gene | Pearson's Correlation | Spearman's Correlation |
| PSMD13 | 0.88 | 0.91 |
| DUT | 0.86 | 0.85 |
| TMEM106C | 0.86 | 0.90 |
| SAMM50 | 0.85 | 0.84 |
| POLR2G | 0.85 | 0.85 |
| HTRA2 | 0.85 | 0.88 |
| COPS6 | 0.84 | 0.85 |
| VPS25 | 0.84 | 0.87 |
| MRPL11 | 0.84 | 0.85 |
| C11orf79 | 0.84 | 0.86 |
| Top 10 negatively co-expressed genes | ||
| Gene | Pearson's Correlation | Spearman's Correlation |
| AF347015.8 | -0.66 | -0.69 |
| AF347015.2 | -0.66 | -0.72 |
| AF347015.26 | -0.66 | -0.74 |
| AF347015.15 | -0.66 | -0.71 |
| AF347015.27 | -0.65 | -0.69 |
| MT-CYB | -0.65 | -0.69 |
| MT-CO2 | -0.64 | -0.65 |
| AF347015.33 | -0.63 | -0.69 |
| AF347015.31 | -0.60 | -0.64 |
| MT-ATP8 | -0.60 | -0.70 |
Section III. Gene Ontology annotation
| Molecular function | GO term | Evidence | Neuro keywords | PubMed ID |
|---|---|---|---|---|
| GO:0051380 | norepinephrine binding | IDA | Neurotransmitter (GO term level: 4) | 15123695 |
| GO:0004872 | receptor activity | IEA | - | |
| GO:0015052 | beta3-adrenergic receptor activity | IMP | 9892244 | |
| GO:0042803 | protein homodimerization activity | IDA | 15123695 | |
| Biological process | GO term | Evidence | Neuro keywords | PubMed ID |
| GO:0002032 | desensitization of G-protein coupled receptor protein signaling pathway by arrestin | IDA | 15123695 | |
| GO:0007190 | activation of adenylate cyclase activity | IDA | 15123695 | |
| GO:0007188 | G-protein signaling, coupled to cAMP nucleotide second messenger | TAS | 1718744 | |
| GO:0006112 | energy reserve metabolic process | TAS | 1718744 | |
| GO:0006091 | generation of precursor metabolites and energy | TAS | 2570461 | |
| GO:0005975 | carbohydrate metabolic process | TAS | 2570461 | |
| GO:0007165 | signal transduction | IEA | - | |
| GO:0006898 | receptor-mediated endocytosis | IDA | 15123695 | |
| GO:0043410 | positive regulation of MAPKKK cascade | IDA | 15123695 | |
| Cellular component | GO term | Evidence | Neuro keywords | PubMed ID |
| GO:0043235 | receptor complex | IDA | Neurotransmitter (GO term level: 4) | 15123695 |
| GO:0005886 | plasma membrane | TAS | 1718744 | |
| GO:0005887 | integral to plasma membrane | TAS | 1718744 |
Section V. Pathway annotation
| Pathway name | Pathway size | # SZGR 2.0 genes in pathway | Info |
|---|---|---|---|
| KEGG CALCIUM SIGNALING PATHWAY | 178 | 134 | All SZGR 2.0 genes in this pathway |
| KEGG NEUROACTIVE LIGAND RECEPTOR INTERACTION | 272 | 195 | All SZGR 2.0 genes in this pathway |
| KEGG ENDOCYTOSIS | 183 | 132 | All SZGR 2.0 genes in this pathway |
| REACTOME SIGNALING BY GPCR | 920 | 449 | All SZGR 2.0 genes in this pathway |
| REACTOME CLASS A1 RHODOPSIN LIKE RECEPTORS | 305 | 177 | All SZGR 2.0 genes in this pathway |
| REACTOME AMINE LIGAND BINDING RECEPTORS | 38 | 33 | All SZGR 2.0 genes in this pathway |
| REACTOME GPCR DOWNSTREAM SIGNALING | 805 | 368 | All SZGR 2.0 genes in this pathway |
| REACTOME G ALPHA S SIGNALLING EVENTS | 121 | 82 | All SZGR 2.0 genes in this pathway |
| REACTOME GPCR LIGAND BINDING | 408 | 246 | All SZGR 2.0 genes in this pathway |
| KINSEY TARGETS OF EWSR1 FLII FUSION UP | 1278 | 748 | All SZGR 2.0 genes in this pathway |
| LANDIS ERBB2 BREAST PRENEOPLASTIC DN | 55 | 33 | All SZGR 2.0 genes in this pathway |
| LANDIS ERBB2 BREAST TUMORS 324 DN | 149 | 93 | All SZGR 2.0 genes in this pathway |
| MCBRYAN PUBERTAL BREAST 4 5WK DN | 196 | 131 | All SZGR 2.0 genes in this pathway |
| BENPORATH SUZ12 TARGETS | 1038 | 678 | All SZGR 2.0 genes in this pathway |
| BENPORATH EED TARGETS | 1062 | 725 | All SZGR 2.0 genes in this pathway |
| BENPORATH ES WITH H3K27ME3 | 1118 | 744 | All SZGR 2.0 genes in this pathway |
| BENPORATH PRC2 TARGETS | 652 | 441 | All SZGR 2.0 genes in this pathway |
| NIKOLSKY BREAST CANCER 8P12 P11 AMPLICON | 57 | 32 | All SZGR 2.0 genes in this pathway |
| TARTE PLASMA CELL VS PLASMABLAST UP | 398 | 262 | All SZGR 2.0 genes in this pathway |
| NADLER OBESITY DN | 48 | 34 | All SZGR 2.0 genes in this pathway |
| NADLER HYPERGLYCEMIA AT OBESITY | 58 | 35 | All SZGR 2.0 genes in this pathway |
| STAEGE EWING FAMILY TUMOR | 33 | 22 | All SZGR 2.0 genes in this pathway |
| RUAN RESPONSE TO TNF TROGLITAZONE DN | 42 | 24 | All SZGR 2.0 genes in this pathway |
| KAYO AGING MUSCLE UP | 244 | 165 | All SZGR 2.0 genes in this pathway |
| RUAN RESPONSE TO TNF DN | 84 | 50 | All SZGR 2.0 genes in this pathway |
| IVANOVA HEMATOPOIESIS STEM CELL AND PROGENITOR | 681 | 420 | All SZGR 2.0 genes in this pathway |
| LI ADIPOGENESIS BY ACTIVATED PPARG | 17 | 12 | All SZGR 2.0 genes in this pathway |
| SARTIPY NORMAL AT INSULIN RESISTANCE DN | 21 | 11 | All SZGR 2.0 genes in this pathway |
| GERHOLD ADIPOGENESIS UP | 49 | 40 | All SZGR 2.0 genes in this pathway |
| RIGGI EWING SARCOMA PROGENITOR UP | 430 | 288 | All SZGR 2.0 genes in this pathway |
| ICHIBA GRAFT VERSUS HOST DISEASE 35D DN | 49 | 34 | All SZGR 2.0 genes in this pathway |
| YOSHIMURA MAPK8 TARGETS UP | 1305 | 895 | All SZGR 2.0 genes in this pathway |
| SWEET LUNG CANCER KRAS DN | 435 | 289 | All SZGR 2.0 genes in this pathway |
| FONTAINE PAPILLARY THYROID CARCINOMA UP | 66 | 38 | All SZGR 2.0 genes in this pathway |
| MIKKELSEN NPC HCP WITH H3K4ME3 AND H3K27ME3 | 210 | 148 | All SZGR 2.0 genes in this pathway |
| MARTENS TRETINOIN RESPONSE UP | 857 | 456 | All SZGR 2.0 genes in this pathway |
| WAKABAYASHI ADIPOGENESIS PPARG BOUND 8D | 658 | 397 | All SZGR 2.0 genes in this pathway |
| VERNOCHET ADIPOGENESIS | 19 | 11 | All SZGR 2.0 genes in this pathway |
Section VI. microRNA annotation
| miRNA family | Target position | miRNA ID | miRNA seq | ||
|---|---|---|---|---|---|
| UTR start | UTR end | Match method | |||
| let-7/98 | 521 | 528 | 1A,m8 | hsa-let-7abrain | UGAGGUAGUAGGUUGUAUAGUU |
| hsa-let-7bbrain | UGAGGUAGUAGGUUGUGUGGUU | ||||
| hsa-let-7cbrain | UGAGGUAGUAGGUUGUAUGGUU | ||||
| hsa-let-7dbrain | AGAGGUAGUAGGUUGCAUAGU | ||||
| hsa-let-7ebrain | UGAGGUAGGAGGUUGUAUAGU | ||||
| hsa-let-7fbrain | UGAGGUAGUAGAUUGUAUAGUU | ||||
| hsa-miR-98brain | UGAGGUAGUAAGUUGUAUUGUU | ||||
| hsa-let-7gSZ | UGAGGUAGUAGUUUGUACAGU | ||||
| hsa-let-7ibrain | UGAGGUAGUAGUUUGUGCUGU | ||||
- SZ: miRNAs which differentially expressed in brain cortex of schizophrenia patients comparing with control samples using microarray. Click here to see the list of SZ related miRNAs.
- Brain: miRNAs which are expressed in brain based on miRNA microarray expression studies. Click here to see the list of brain related miRNAs.