Gene Page: RHBDL3
Summary ?
| GeneID | 162494 |
| Symbol | RHBDL3 |
| Synonyms | RHBDL4|VRHO |
| Description | rhomboid, veinlet-like 3 (Drosophila) |
| Reference | HGNC:HGNC:16502|Ensembl:ENSG00000141314|HPRD:07501|Vega:OTTHUMG00000179568 |
| Gene type | protein-coding |
| Map location | 17q11.2 |
| Pascal p-value | 2.806E-5 |
| Sherlock p-value | 0.717 |
| Fetal beta | -0.449 |
| DMG | 1 (# studies) |
| eGene | Nucleus accumbens basal ganglia Putamen basal ganglia |
Gene in Data Sources
| Gene set name | Method of gene set | Description | Info |
|---|---|---|---|
| CV:PGCnp | Genome-wide Association Study | GWAS | |
| DMG:Wockner_2014 | Genome-wide DNA methylation analysis | This dataset includes 4641 differentially methylated probes corresponding to 2929 unique genes between schizophrenia patients (n=24) and controls (n=24). | 1 |
| GO_Annotation | Mapping neuro-related keywords to Gene Ontology annotations | Hits with neuro-related keywords: 1 |
Section I. Genetics and epigenetics annotation
 Differentially methylated gene
| Probe | Chromosome | Position | Nearest gene | P (dis) | Beta (dis) | FDR (dis) | Study |
|---|---|---|---|---|---|---|---|
| cg22976366 | 17 | 30608367 | RHBDL3 | 5.724E-4 | -0.278 | 0.049 | DMG:Wockner_2014 |
eQTL annotation
| SNP ID | Chromosome | Position | eGene | Gene Entrez ID | pvalue | qvalue | TSS distance | eQTL type |
|---|---|---|---|---|---|---|---|---|
| rs1860410 | 17 | 30628733 | RHBDL3 | ENSG00000141314.8 | 2.088E-7 | 0 | 35538 | gtex_brain_putamen_basal |
| rs60947667 | 17 | 30629365 | RHBDL3 | ENSG00000141314.8 | 2.574E-7 | 0 | 36170 | gtex_brain_putamen_basal |
| rs16967266 | 17 | 30632274 | RHBDL3 | ENSG00000141314.8 | 5.495E-8 | 0 | 39079 | gtex_brain_putamen_basal |
| rs8074594 | 17 | 30632998 | RHBDL3 | ENSG00000141314.8 | 5.463E-8 | 0 | 39803 | gtex_brain_putamen_basal |
| rs4794915 | 17 | 30634363 | RHBDL3 | ENSG00000141314.8 | 5.685E-8 | 0 | 41168 | gtex_brain_putamen_basal |
| rs11657299 | 17 | 30634951 | RHBDL3 | ENSG00000141314.8 | 5.738E-8 | 0 | 41756 | gtex_brain_putamen_basal |
| rs11653974 | 17 | 30635002 | RHBDL3 | ENSG00000141314.8 | 5.685E-8 | 0 | 41807 | gtex_brain_putamen_basal |
| rs62064225 | 17 | 30635429 | RHBDL3 | ENSG00000141314.8 | 5.718E-8 | 0 | 42234 | gtex_brain_putamen_basal |
| rs4794916 | 17 | 30635954 | RHBDL3 | ENSG00000141314.8 | 5.786E-8 | 0 | 42759 | gtex_brain_putamen_basal |
| rs4794917 | 17 | 30636146 | RHBDL3 | ENSG00000141314.8 | 5.778E-8 | 0 | 42951 | gtex_brain_putamen_basal |
| rs4795692 | 17 | 30636688 | RHBDL3 | ENSG00000141314.8 | 7.118E-8 | 0 | 43493 | gtex_brain_putamen_basal |
| rs4795693 | 17 | 30636727 | RHBDL3 | ENSG00000141314.8 | 7.236E-8 | 0 | 43532 | gtex_brain_putamen_basal |
| rs57002890 | 17 | 30637371 | RHBDL3 | ENSG00000141314.8 | 9.868E-8 | 0 | 44176 | gtex_brain_putamen_basal |
| rs202213910 | 17 | 30637730 | RHBDL3 | ENSG00000141314.8 | 7.02E-7 | 0 | 44535 | gtex_brain_putamen_basal |
Section II. Transcriptome annotation
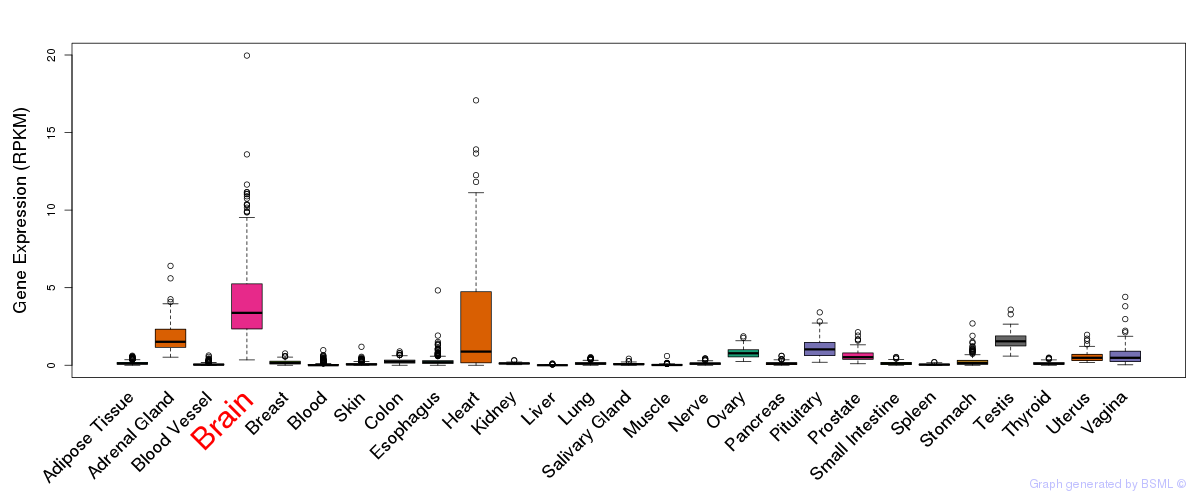
General gene expression (GTEx)
Gene expression during devlopment (BrainCloud)
Footnote:
A total of 269 time points ploted, with n=38 fetal samples (x=1:38). Each triangle represents one time point.
Gene expression of temporal and spatial changes (BrainSpan)
Footnote:
SC: sub-cortical regions; SM: sensory-motor regions; FC: frontal cortex; and TP: temporal-parietal cortex
ST1: fetal (13 - 26 postconception weeks), ST2: early infancy to late childhood (4 months to 11 years), and ST3: adolescence to adulthood (13 - 23 years)
The bar shown representes the lower 25% and upper 25% of the expression distribution.
No co-expressed genes in brain regions
Section III. Gene Ontology annotation
| Molecular function | GO term | Evidence | Neuro keywords | PubMed ID |
|---|---|---|---|---|
| GO:0004252 | serine-type endopeptidase activity | IEA | glutamate (GO term level: 7) | - |
| GO:0005509 | calcium ion binding | IEA | - | |
| GO:0008233 | peptidase activity | IEA | - | |
| Biological process | GO term | Evidence | Neuro keywords | PubMed ID |
| GO:0007165 | signal transduction | IEA | - | |
| Cellular component | GO term | Evidence | Neuro keywords | PubMed ID |
| GO:0016020 | membrane | IEA | - | |
| GO:0016021 | integral to membrane | IEA | - |
Section V. Pathway annotation
| Pathway name | Pathway size | # SZGR 2.0 genes in pathway | Info |
|---|---|---|---|
| BIDUS METASTASIS UP | 214 | 134 | All SZGR 2.0 genes in this pathway |
| MARTORIATI MDM4 TARGETS NEUROEPITHELIUM DN | 164 | 111 | All SZGR 2.0 genes in this pathway |
| SCHAEFFER PROSTATE DEVELOPMENT 48HR DN | 428 | 306 | All SZGR 2.0 genes in this pathway |
| MARTINEZ RB1 TARGETS DN | 543 | 317 | All SZGR 2.0 genes in this pathway |
| MARTINEZ TP53 TARGETS DN | 593 | 372 | All SZGR 2.0 genes in this pathway |
| MARTINEZ RB1 AND TP53 TARGETS DN | 591 | 366 | All SZGR 2.0 genes in this pathway |
| WANG RESPONSE TO GSK3 INHIBITOR SB216763 DN | 374 | 217 | All SZGR 2.0 genes in this pathway |
Section VI. microRNA annotation
| miRNA family | Target position | miRNA ID | miRNA seq | ||
|---|---|---|---|---|---|
| UTR start | UTR end | Match method | |||
| miR-124.1 | 3249 | 3256 | 1A,m8 | hsa-miR-124a | UUAAGGCACGCGGUGAAUGCCA |
| miR-124/506 | 3249 | 3255 | 1A | hsa-miR-506 | UAAGGCACCCUUCUGAGUAGA |
| hsa-miR-124brain | UAAGGCACGCGGUGAAUGCC | ||||
| miR-31 | 3083 | 3089 | m8 | hsa-miR-31 | AGGCAAGAUGCUGGCAUAGCUG |
- SZ: miRNAs which differentially expressed in brain cortex of schizophrenia patients comparing with control samples using microarray. Click here to see the list of SZ related miRNAs.
- Brain: miRNAs which are expressed in brain based on miRNA microarray expression studies. Click here to see the list of brain related miRNAs.