Gene Page: COBLL1
Summary ?
| GeneID | 22837 |
| Symbol | COBLL1 |
| Synonyms | COBLR1 |
| Description | cordon-bleu WH2 repeat protein like 1 |
| Reference | MIM:610318|HGNC:HGNC:23571|Ensembl:ENSG00000082438|HPRD:10844|Vega:OTTHUMG00000074019 |
| Gene type | protein-coding |
| Map location | 2q24.3 |
| Pascal p-value | 0.905 |
| Sherlock p-value | 0.294 |
| Fetal beta | -0.713 |
| eGene | Myers' cis & trans |
Gene in Data Sources
| Gene set name | Method of gene set | Description | Info |
|---|---|---|---|
| CV:GWASdb | Genome-wide Association Studies | GWASdb records for schizophrenia | |
| CV:PGCnp | Genome-wide Association Study | GWAS | |
| GSMA_IIA | Genome scan meta-analysis (All samples) | Psr: 0.02395 |
Section I. Genetics and epigenetics annotation
 eQTL annotation
| SNP ID | Chromosome | Position | eGene | Gene Entrez ID | pvalue | qvalue | TSS distance | eQTL type |
|---|---|---|---|---|---|---|---|---|
| rs12679851 | chr8 | 111610382 | COBLL1 | 22837 | 0.08 | trans |
Section II. Transcriptome annotation
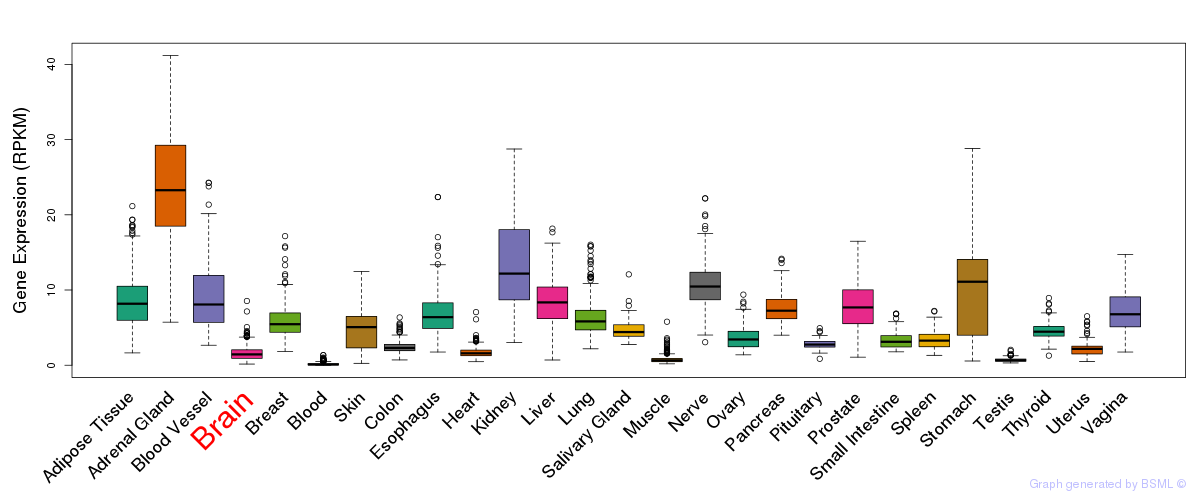
General gene expression (GTEx)
Gene expression during devlopment (BrainCloud)
Footnote:
A total of 269 time points ploted, with n=38 fetal samples (x=1:38). Each triangle represents one time point.
Gene expression of temporal and spatial changes (BrainSpan)
Footnote:
SC: sub-cortical regions; SM: sensory-motor regions; FC: frontal cortex; and TP: temporal-parietal cortex
ST1: fetal (13 - 26 postconception weeks), ST2: early infancy to late childhood (4 months to 11 years), and ST3: adolescence to adulthood (13 - 23 years)
The bar shown representes the lower 25% and upper 25% of the expression distribution.
Top co-expressed genes in brain regions
| Top 10 positively co-expressed genes | ||
| Gene | Pearson's Correlation | Spearman's Correlation |
| PHF12 | 0.96 | 0.95 |
| PPIL2 | 0.96 | 0.96 |
| ZNF142 | 0.96 | 0.96 |
| KIAA0892 | 0.95 | 0.95 |
| SRCAP | 0.95 | 0.96 |
| ZNF384 | 0.95 | 0.95 |
| PTPN23 | 0.95 | 0.96 |
| TSC2 | 0.95 | 0.96 |
| PIK3C2B | 0.95 | 0.94 |
| AHDC1 | 0.95 | 0.96 |
| Top 10 negatively co-expressed genes | ||
| Gene | Pearson's Correlation | Spearman's Correlation |
| AF347015.31 | -0.76 | -0.86 |
| MT-CO2 | -0.74 | -0.86 |
| AF347015.27 | -0.73 | -0.83 |
| AF347015.33 | -0.72 | -0.80 |
| MT-CYB | -0.71 | -0.81 |
| S100B | -0.71 | -0.80 |
| AF347015.8 | -0.71 | -0.83 |
| C5orf53 | -0.71 | -0.73 |
| FXYD1 | -0.71 | -0.80 |
| HIGD1B | -0.70 | -0.84 |
Section V. Pathway annotation
| Pathway name | Pathway size | # SZGR 2.0 genes in pathway | Info |
|---|---|---|---|
| ONKEN UVEAL MELANOMA DN | 526 | 357 | All SZGR 2.0 genes in this pathway |
| HUTTMANN B CLL POOR SURVIVAL DN | 60 | 39 | All SZGR 2.0 genes in this pathway |
| BASAKI YBX1 TARGETS DN | 384 | 230 | All SZGR 2.0 genes in this pathway |
| WANG LMO4 TARGETS DN | 352 | 225 | All SZGR 2.0 genes in this pathway |
| WANG CLIM2 TARGETS DN | 186 | 114 | All SZGR 2.0 genes in this pathway |
| SENESE HDAC1 TARGETS UP | 457 | 269 | All SZGR 2.0 genes in this pathway |
| LEE NEURAL CREST STEM CELL UP | 146 | 99 | All SZGR 2.0 genes in this pathway |
| GOZGIT ESR1 TARGETS DN | 781 | 465 | All SZGR 2.0 genes in this pathway |
| COLDREN GEFITINIB RESISTANCE DN | 230 | 115 | All SZGR 2.0 genes in this pathway |
| NUYTTEN EZH2 TARGETS UP | 1037 | 673 | All SZGR 2.0 genes in this pathway |
| SCHAEFFER PROSTATE DEVELOPMENT 48HR UP | 487 | 286 | All SZGR 2.0 genes in this pathway |
| AMIT SERUM RESPONSE 60 MCF10A | 57 | 42 | All SZGR 2.0 genes in this pathway |
| GEORGES TARGETS OF MIR192 AND MIR215 | 893 | 528 | All SZGR 2.0 genes in this pathway |
| ONDER CDH1 TARGETS 2 DN | 464 | 276 | All SZGR 2.0 genes in this pathway |
| IIZUKA LIVER CANCER PROGRESSION G2 G3 UP | 28 | 14 | All SZGR 2.0 genes in this pathway |
| FLECHNER BIOPSY KIDNEY TRANSPLANT REJECTED VS OK DN | 546 | 351 | All SZGR 2.0 genes in this pathway |
| HASLINGER B CLL WITH MUTATED VH GENES | 18 | 14 | All SZGR 2.0 genes in this pathway |
| YAMAZAKI TCEB3 TARGETS UP | 175 | 116 | All SZGR 2.0 genes in this pathway |
| IVANOVA HEMATOPOIESIS STEM CELL | 254 | 164 | All SZGR 2.0 genes in this pathway |
| DURCHDEWALD SKIN CARCINOGENESIS DN | 264 | 168 | All SZGR 2.0 genes in this pathway |
| CREIGHTON ENDOCRINE THERAPY RESISTANCE 5 | 482 | 296 | All SZGR 2.0 genes in this pathway |
| ZHENG BOUND BY FOXP3 | 491 | 310 | All SZGR 2.0 genes in this pathway |
| MARSON BOUND BY FOXP3 STIMULATED | 1022 | 619 | All SZGR 2.0 genes in this pathway |
| ZHENG FOXP3 TARGETS UP | 26 | 16 | All SZGR 2.0 genes in this pathway |
| MASSARWEH TAMOXIFEN RESISTANCE UP | 578 | 341 | All SZGR 2.0 genes in this pathway |
| MATTHEWS SKIN CARCINOGENESIS VIA JUN | 17 | 10 | All SZGR 2.0 genes in this pathway |
| LEE LIVER CANCER SURVIVAL UP | 185 | 112 | All SZGR 2.0 genes in this pathway |
| VALK AML CLUSTER 1 | 28 | 19 | All SZGR 2.0 genes in this pathway |
| JISON SICKLE CELL DISEASE DN | 181 | 97 | All SZGR 2.0 genes in this pathway |
| BOYAULT LIVER CANCER SUBCLASS G23 DN | 10 | 7 | All SZGR 2.0 genes in this pathway |
| HOSHIDA LIVER CANCER LATE RECURRENCE DN | 69 | 48 | All SZGR 2.0 genes in this pathway |
| DUTERTRE ESTRADIOL RESPONSE 24HR DN | 505 | 328 | All SZGR 2.0 genes in this pathway |
| GABRIELY MIR21 TARGETS | 289 | 187 | All SZGR 2.0 genes in this pathway |
| KOINUMA TARGETS OF SMAD2 OR SMAD3 | 824 | 528 | All SZGR 2.0 genes in this pathway |
Section VI. microRNA annotation
| miRNA family | Target position | miRNA ID | miRNA seq | ||
|---|---|---|---|---|---|
| UTR start | UTR end | Match method | |||
| miR-15/16/195/424/497 | 216 | 222 | m8 | hsa-miR-15abrain | UAGCAGCACAUAAUGGUUUGUG |
| hsa-miR-16brain | UAGCAGCACGUAAAUAUUGGCG | ||||
| hsa-miR-15bbrain | UAGCAGCACAUCAUGGUUUACA | ||||
| hsa-miR-195SZ | UAGCAGCACAGAAAUAUUGGC | ||||
| hsa-miR-424 | CAGCAGCAAUUCAUGUUUUGAA | ||||
| hsa-miR-497 | CAGCAGCACACUGUGGUUUGU | ||||
| miR-493-5p | 86 | 92 | m8 | hsa-miR-493-5p | UUGUACAUGGUAGGCUUUCAUU |
- SZ: miRNAs which differentially expressed in brain cortex of schizophrenia patients comparing with control samples using microarray. Click here to see the list of SZ related miRNAs.
- Brain: miRNAs which are expressed in brain based on miRNA microarray expression studies. Click here to see the list of brain related miRNAs.