Gene Page: SYNM
Summary ?
| GeneID | 23336 |
| Symbol | SYNM |
| Synonyms | DMN|SYN |
| Description | synemin |
| Reference | MIM:606087|HGNC:HGNC:24466|Ensembl:ENSG00000182253|HPRD:07305|Vega:OTTHUMG00000171887 |
| Gene type | protein-coding |
| Map location | 15q26.3 |
| Pascal p-value | 0.053 |
| Sherlock p-value | 2.655E-5 |
| Fetal beta | -2.417 |
| DMG | 1 (# studies) |
| eGene | Cerebellar Hemisphere Cerebellum Cortex Meta |
Gene in Data Sources
| Gene set name | Method of gene set | Description | Info |
|---|---|---|---|
| CV:PGCnp | Genome-wide Association Study | GWAS | |
| DMG:Jaffe_2016 | Genome-wide DNA methylation analysis | This dataset includes 2,104 probes/CpGs associated with SZ patients (n=108) compared to 136 controls at Bonferroni-adjusted P < 0.05. | 1 |
Section I. Genetics and epigenetics annotation
 Differentially methylated gene
| Probe | Chromosome | Position | Nearest gene | P (dis) | Beta (dis) | FDR (dis) | Study |
|---|---|---|---|---|---|---|---|
| cg24917799 | 15 | 99602817 | SYNM | 1.04E-7 | -0.009 | 2.28E-5 | DMG:Jaffe_2016 |
Section II. Transcriptome annotation
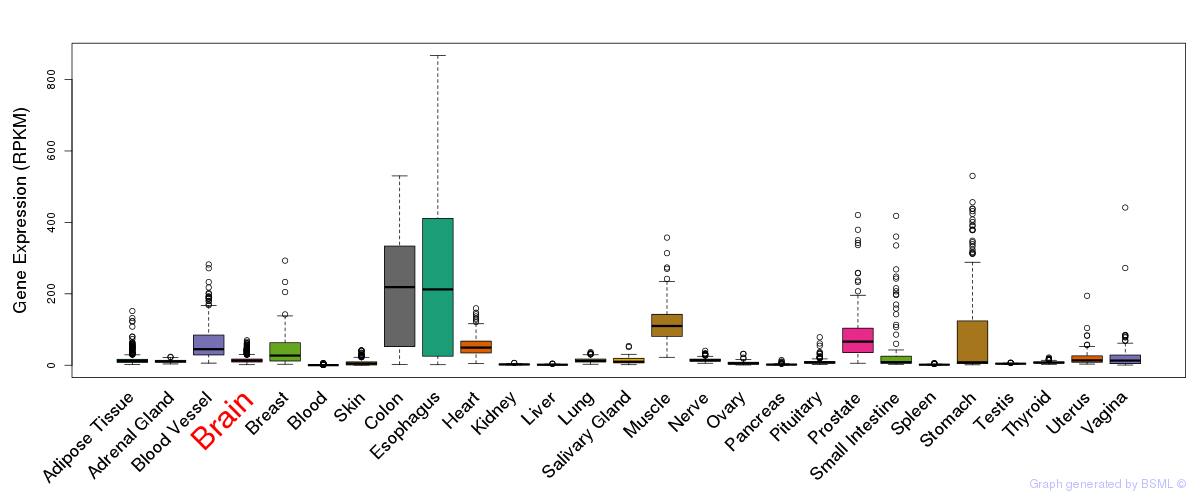
General gene expression (GTEx)
Gene expression during devlopment (BrainCloud)
Footnote:
A total of 269 time points ploted, with n=38 fetal samples (x=1:38). Each triangle represents one time point.
Gene expression of temporal and spatial changes (BrainSpan)
Footnote:
SC: sub-cortical regions; SM: sensory-motor regions; FC: frontal cortex; and TP: temporal-parietal cortex
ST1: fetal (13 - 26 postconception weeks), ST2: early infancy to late childhood (4 months to 11 years), and ST3: adolescence to adulthood (13 - 23 years)
The bar shown representes the lower 25% and upper 25% of the expression distribution.
Top co-expressed genes in brain regions
| Top 10 positively co-expressed genes | ||
| Gene | Pearson's Correlation | Spearman's Correlation |
| GOT1 | 0.91 | 0.88 |
| ATP6V1E1 | 0.90 | 0.89 |
| GHITM | 0.89 | 0.87 |
| HPRT1 | 0.89 | 0.90 |
| FBXO9 | 0.89 | 0.89 |
| GDE1 | 0.89 | 0.85 |
| MDH1 | 0.89 | 0.86 |
| ATG7 | 0.89 | 0.85 |
| SNURF | 0.88 | 0.89 |
| MAPK10 | 0.88 | 0.86 |
| Top 10 negatively co-expressed genes | ||
| Gene | Pearson's Correlation | Spearman's Correlation |
| SH3BP2 | -0.42 | -0.48 |
| FADS2 | -0.41 | -0.36 |
| CDC42EP4 | -0.41 | -0.39 |
| SH2D2A | -0.40 | -0.43 |
| AF347015.18 | -0.39 | -0.16 |
| AC010300.1 | -0.39 | -0.38 |
| ANP32C | -0.39 | -0.38 |
| OLFM2 | -0.39 | -0.34 |
| RBMX2 | -0.39 | -0.36 |
| SMTN | -0.38 | -0.40 |
Section V. Pathway annotation
| Pathway name | Pathway size | # SZGR 2.0 genes in pathway | Info |
|---|---|---|---|
| ONKEN UVEAL MELANOMA DN | 526 | 357 | All SZGR 2.0 genes in this pathway |
| TURASHVILI BREAST DUCTAL CARCINOMA VS DUCTAL NORMAL DN | 198 | 110 | All SZGR 2.0 genes in this pathway |
| TURASHVILI BREAST DUCTAL CARCINOMA VS LOBULAR NORMAL DN | 69 | 43 | All SZGR 2.0 genes in this pathway |
| TURASHVILI BREAST LOBULAR CARCINOMA VS DUCTAL NORMAL DN | 91 | 53 | All SZGR 2.0 genes in this pathway |
| TURASHVILI BREAST LOBULAR CARCINOMA VS LOBULAR NORMAL UP | 94 | 59 | All SZGR 2.0 genes in this pathway |
| VECCHI GASTRIC CANCER EARLY DN | 367 | 220 | All SZGR 2.0 genes in this pathway |
| DELYS THYROID CANCER DN | 232 | 154 | All SZGR 2.0 genes in this pathway |
| GAUSSMANN MLL AF4 FUSION TARGETS F UP | 185 | 119 | All SZGR 2.0 genes in this pathway |
| PEREZ TP53 TARGETS | 1174 | 695 | All SZGR 2.0 genes in this pathway |
| DACOSTA ERCC3 ALLELE XPCS VS TTD DN | 36 | 27 | All SZGR 2.0 genes in this pathway |
| DACOSTA UV RESPONSE VIA ERCC3 UP | 309 | 199 | All SZGR 2.0 genes in this pathway |
| MARTORIATI MDM4 TARGETS NEUROEPITHELIUM UP | 176 | 111 | All SZGR 2.0 genes in this pathway |
| MARTORIATI MDM4 TARGETS FETAL LIVER UP | 227 | 137 | All SZGR 2.0 genes in this pathway |
| KOYAMA SEMA3B TARGETS DN | 411 | 249 | All SZGR 2.0 genes in this pathway |
| NIKOLSKY BREAST CANCER 15Q26 AMPLICON | 22 | 19 | All SZGR 2.0 genes in this pathway |
| ONDER CDH1 TARGETS 2 UP | 256 | 159 | All SZGR 2.0 genes in this pathway |
| BLALOCK ALZHEIMERS DISEASE UP | 1691 | 1088 | All SZGR 2.0 genes in this pathway |
| DEBIASI APOPTOSIS BY REOVIRUS INFECTION DN | 287 | 208 | All SZGR 2.0 genes in this pathway |
| BROWNE HCMV INFECTION 12HR UP | 111 | 68 | All SZGR 2.0 genes in this pathway |
| BILD E2F3 ONCOGENIC SIGNATURE | 246 | 153 | All SZGR 2.0 genes in this pathway |
| IWANAGA CARCINOGENESIS BY KRAS PTEN DN | 353 | 226 | All SZGR 2.0 genes in this pathway |
| SMID BREAST CANCER RELAPSE IN BONE DN | 315 | 197 | All SZGR 2.0 genes in this pathway |
| SMID BREAST CANCER LUMINAL B DN | 564 | 326 | All SZGR 2.0 genes in this pathway |
| SMID BREAST CANCER NORMAL LIKE UP | 476 | 285 | All SZGR 2.0 genes in this pathway |
| SMID BREAST CANCER BASAL UP | 648 | 398 | All SZGR 2.0 genes in this pathway |
| BOQUEST STEM CELL CULTURED VS FRESH UP | 425 | 298 | All SZGR 2.0 genes in this pathway |
| MEISSNER NPC HCP WITH H3K4ME3 AND H3K27ME3 | 142 | 103 | All SZGR 2.0 genes in this pathway |
| CROONQUIST NRAS VS STROMAL STIMULATION UP | 41 | 26 | All SZGR 2.0 genes in this pathway |
| POOLA INVASIVE BREAST CANCER DN | 134 | 83 | All SZGR 2.0 genes in this pathway |
| MIKKELSEN NPC HCP WITH H3K4ME3 AND H3K27ME3 | 210 | 148 | All SZGR 2.0 genes in this pathway |
| NIELSEN GIST VS SYNOVIAL SARCOMA DN | 20 | 17 | All SZGR 2.0 genes in this pathway |
| NIELSEN GIST | 98 | 66 | All SZGR 2.0 genes in this pathway |
| MIYAGAWA TARGETS OF EWSR1 ETS FUSIONS DN | 229 | 135 | All SZGR 2.0 genes in this pathway |
| PHONG TNF RESPONSE VIA P38 COMPLETE | 227 | 151 | All SZGR 2.0 genes in this pathway |
| ACEVEDO FGFR1 TARGETS IN PROSTATE CANCER MODEL DN | 308 | 187 | All SZGR 2.0 genes in this pathway |
| LIM MAMMARY STEM CELL UP | 489 | 314 | All SZGR 2.0 genes in this pathway |