Gene Page: ICT1
Summary ?
| GeneID | 3396 |
| Symbol | ICT1 |
| Synonyms | DS-1|DS1|MRP-L58 |
| Description | immature colon carcinoma transcript 1 |
| Reference | MIM:603000|HGNC:HGNC:5359|Ensembl:ENSG00000167862|HPRD:04299|Vega:OTTHUMG00000179218 |
| Gene type | protein-coding |
| Map location | 17q25.1 |
| Pascal p-value | 0.173 |
| Sherlock p-value | 0.037 |
| Fetal beta | -0.197 |
Gene in Data Sources
| Gene set name | Method of gene set | Description | Info |
|---|---|---|---|
| CV:PGCnp | Genome-wide Association Study | GWAS |
Section I. Genetics and epigenetics annotation
Section II. Transcriptome annotation
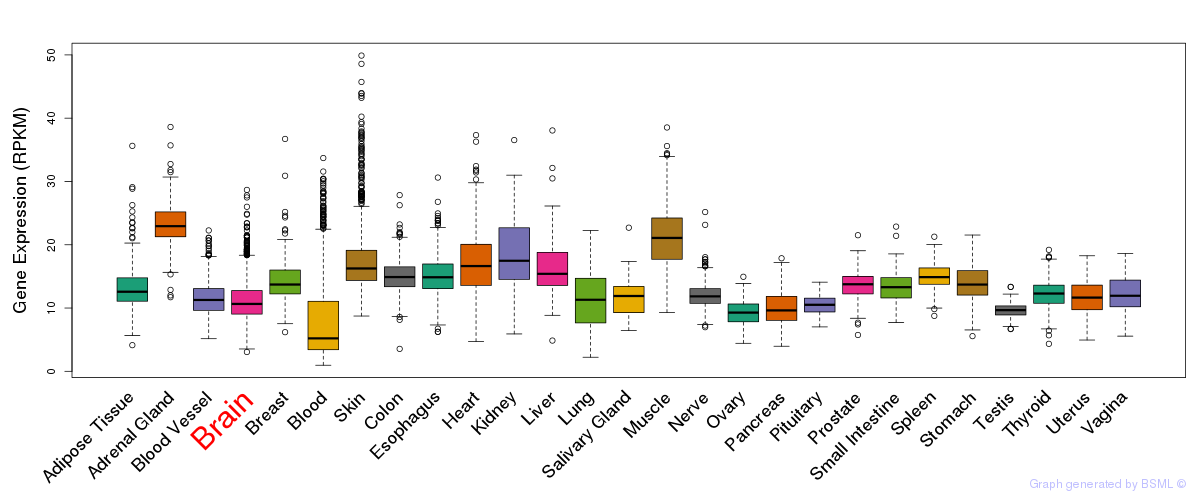
General gene expression (GTEx)
Gene expression during devlopment (BrainCloud)
Footnote:
A total of 269 time points ploted, with n=38 fetal samples (x=1:38). Each triangle represents one time point.
Gene expression of temporal and spatial changes (BrainSpan)
Footnote:
SC: sub-cortical regions; SM: sensory-motor regions; FC: frontal cortex; and TP: temporal-parietal cortex
ST1: fetal (13 - 26 postconception weeks), ST2: early infancy to late childhood (4 months to 11 years), and ST3: adolescence to adulthood (13 - 23 years)
The bar shown representes the lower 25% and upper 25% of the expression distribution.
Top co-expressed genes in brain regions
| Top 10 positively co-expressed genes | ||
| Gene | Pearson's Correlation | Spearman's Correlation |
| CLCN3 | 0.89 | 0.88 |
| TM9SF3 | 0.88 | 0.88 |
| TBCEL | 0.87 | 0.87 |
| RAB3GAP2 | 0.87 | 0.88 |
| PDZD8 | 0.86 | 0.86 |
| NF1 | 0.86 | 0.88 |
| GARNL1 | 0.86 | 0.87 |
| DENND4A | 0.86 | 0.87 |
| PIKFYVE | 0.86 | 0.87 |
| ATF6 | 0.86 | 0.86 |
| Top 10 negatively co-expressed genes | ||
| Gene | Pearson's Correlation | Spearman's Correlation |
| AF347015.21 | -0.65 | -0.59 |
| FXYD1 | -0.63 | -0.60 |
| MT-CO2 | -0.62 | -0.60 |
| AF347015.31 | -0.60 | -0.58 |
| HIGD1B | -0.60 | -0.58 |
| C1orf54 | -0.59 | -0.59 |
| AF347015.33 | -0.58 | -0.55 |
| ENHO | -0.58 | -0.62 |
| AF347015.8 | -0.58 | -0.57 |
| CSAG1 | -0.57 | -0.54 |
Section V. Pathway annotation
| Pathway name | Pathway size | # SZGR 2.0 genes in pathway | Info |
|---|---|---|---|
| ZHONG RESPONSE TO AZACITIDINE AND TSA DN | 70 | 38 | All SZGR 2.0 genes in this pathway |
| ZHOU INFLAMMATORY RESPONSE LIVE DN | 384 | 220 | All SZGR 2.0 genes in this pathway |
| DIAZ CHRONIC MEYLOGENOUS LEUKEMIA UP | 1382 | 904 | All SZGR 2.0 genes in this pathway |
| SENESE HDAC3 TARGETS DN | 536 | 332 | All SZGR 2.0 genes in this pathway |
| GRAESSMANN APOPTOSIS BY DOXORUBICIN DN | 1781 | 1082 | All SZGR 2.0 genes in this pathway |
| GRAESSMANN RESPONSE TO MC AND DOXORUBICIN DN | 770 | 415 | All SZGR 2.0 genes in this pathway |
| LASTOWSKA NEUROBLASTOMA COPY NUMBER UP | 181 | 108 | All SZGR 2.0 genes in this pathway |
| MATTIOLI MGUS VS PCL | 116 | 62 | All SZGR 2.0 genes in this pathway |
| SCHLOSSER SERUM RESPONSE AUGMENTED BY MYC | 108 | 74 | All SZGR 2.0 genes in this pathway |
| PUJANA BRCA1 PCC NETWORK | 1652 | 1023 | All SZGR 2.0 genes in this pathway |
| PUJANA CHEK2 PCC NETWORK | 779 | 480 | All SZGR 2.0 genes in this pathway |
| WEI MYCN TARGETS WITH E BOX | 795 | 478 | All SZGR 2.0 genes in this pathway |
| NIKOLSKY BREAST CANCER 17Q21 Q25 AMPLICON | 335 | 181 | All SZGR 2.0 genes in this pathway |
| SMITH TERT TARGETS UP | 145 | 91 | All SZGR 2.0 genes in this pathway |
| TARTE PLASMA CELL VS PLASMABLAST DN | 309 | 206 | All SZGR 2.0 genes in this pathway |
| PENG RAPAMYCIN RESPONSE DN | 245 | 154 | All SZGR 2.0 genes in this pathway |
| GUO HEX TARGETS DN | 65 | 36 | All SZGR 2.0 genes in this pathway |
| ZHAN MULTIPLE MYELOMA UP | 64 | 46 | All SZGR 2.0 genes in this pathway |
| ACEVEDO LIVER TUMOR VS NORMAL ADJACENT TISSUE UP | 863 | 514 | All SZGR 2.0 genes in this pathway |
| MOOTHA PGC | 420 | 269 | All SZGR 2.0 genes in this pathway |
| YAO TEMPORAL RESPONSE TO PROGESTERONE CLUSTER 17 | 181 | 101 | All SZGR 2.0 genes in this pathway |