Gene Page: NEU2
Summary ?
| GeneID | 4759 |
| Symbol | NEU2 |
| Synonyms | SIAL2 |
| Description | neuraminidase 2 (cytosolic sialidase) |
| Reference | MIM:605528|HGNC:HGNC:7759|Ensembl:ENSG00000115488|HPRD:05702|Vega:OTTHUMG00000133274 |
| Gene type | protein-coding |
| Map location | 2q37 |
| Pascal p-value | 0.028 |
| Fetal beta | -0.278 |
Gene in Data Sources
| Gene set name | Method of gene set | Description | Info |
|---|---|---|---|
| CV:GWAScat | Genome-wide Association Studies | This data set includes 560 SNPs associated with schizophrenia. A total of 486 genes were mapped to these SNPs within 50kb. | |
| CV:PGCnp | Genome-wide Association Study | GWAS |
Section I. Genetics and epigenetics annotation
Section II. Transcriptome annotation
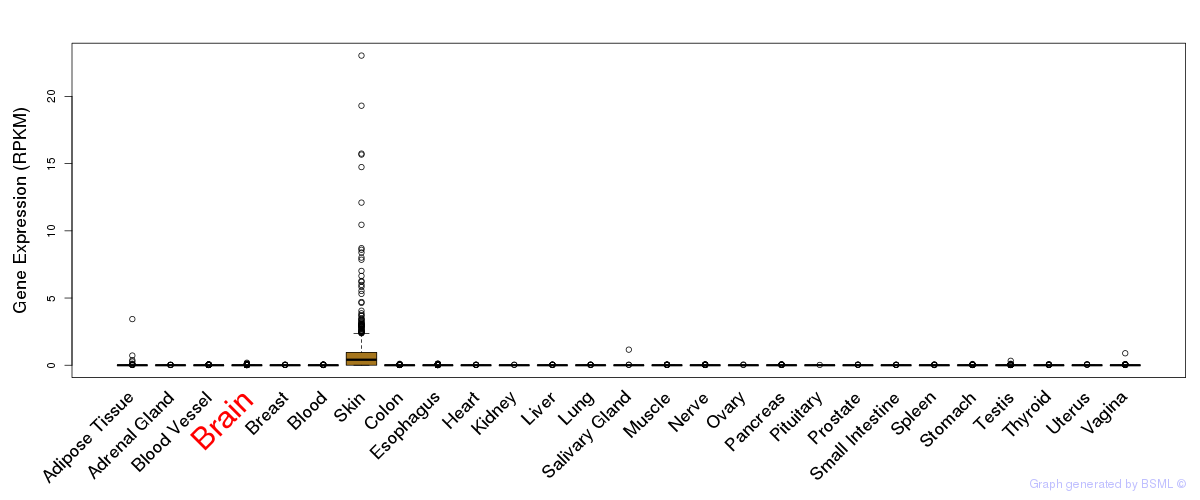
General gene expression (GTEx)
Gene expression during devlopment (BrainCloud)
Footnote:
A total of 269 time points ploted, with n=38 fetal samples (x=1:38). Each triangle represents one time point.
Gene expression of temporal and spatial changes (BrainSpan)
Footnote:
SC: sub-cortical regions; SM: sensory-motor regions; FC: frontal cortex; and TP: temporal-parietal cortex
ST1: fetal (13 - 26 postconception weeks), ST2: early infancy to late childhood (4 months to 11 years), and ST3: adolescence to adulthood (13 - 23 years)
The bar shown representes the lower 25% and upper 25% of the expression distribution.
Top co-expressed genes in brain regions
| Top 10 positively co-expressed genes | ||
| Gene | Pearson's Correlation | Spearman's Correlation |
| CTNNA1 | 0.86 | 0.82 |
| XPC | 0.84 | 0.83 |
| SPAG9 | 0.83 | 0.81 |
| FKBP15 | 0.83 | 0.81 |
| SLC15A4 | 0.82 | 0.81 |
| SP2 | 0.82 | 0.79 |
| SS18 | 0.81 | 0.79 |
| FUBP3 | 0.81 | 0.74 |
| CTDSP2 | 0.80 | 0.79 |
| ATF7 | 0.80 | 0.79 |
| Top 10 negatively co-expressed genes | ||
| Gene | Pearson's Correlation | Spearman's Correlation |
| AF347015.21 | -0.63 | -0.61 |
| C1orf54 | -0.59 | -0.56 |
| AF347015.31 | -0.55 | -0.54 |
| SYCP3 | -0.55 | -0.52 |
| MT-CO2 | -0.54 | -0.53 |
| AC044839.2 | -0.53 | -0.55 |
| ENHO | -0.53 | -0.53 |
| VAMP5 | -0.53 | -0.48 |
| AL050337.1 | -0.53 | -0.45 |
| IFI27 | -0.52 | -0.49 |
Section V. Pathway annotation
| Pathway name | Pathway size | # SZGR 2.0 genes in pathway | Info |
|---|---|---|---|
| KEGG OTHER GLYCAN DEGRADATION | 16 | 12 | All SZGR 2.0 genes in this pathway |
| KEGG SPHINGOLIPID METABOLISM | 40 | 26 | All SZGR 2.0 genes in this pathway |
| REACTOME GLYCOSPHINGOLIPID METABOLISM | 38 | 22 | All SZGR 2.0 genes in this pathway |
| REACTOME PHOSPHOLIPID METABOLISM | 198 | 112 | All SZGR 2.0 genes in this pathway |
| REACTOME SPHINGOLIPID METABOLISM | 69 | 40 | All SZGR 2.0 genes in this pathway |
| REACTOME METABOLISM OF LIPIDS AND LIPOPROTEINS | 478 | 302 | All SZGR 2.0 genes in this pathway |
| PETRETTO HEART MASS QTL CIS DN | 24 | 15 | All SZGR 2.0 genes in this pathway |
| MARTINEZ RB1 TARGETS UP | 673 | 430 | All SZGR 2.0 genes in this pathway |
| MARTINEZ TP53 TARGETS UP | 602 | 364 | All SZGR 2.0 genes in this pathway |
| MARTINEZ RB1 AND TP53 TARGETS UP | 601 | 369 | All SZGR 2.0 genes in this pathway |
| LABBE TGFB1 TARGETS DN | 108 | 64 | All SZGR 2.0 genes in this pathway |
| YOSHIMURA MAPK8 TARGETS UP | 1305 | 895 | All SZGR 2.0 genes in this pathway |
| SHEDDEN LUNG CANCER GOOD SURVIVAL A12 | 317 | 177 | All SZGR 2.0 genes in this pathway |
| MARTENS TRETINOIN RESPONSE UP | 857 | 456 | All SZGR 2.0 genes in this pathway |