Gene Page: YEATS2
Summary ?
| GeneID | 55689 |
| Symbol | YEATS2 |
| Synonyms | - |
| Description | YEATS domain containing 2 |
| Reference | MIM:613373|HGNC:HGNC:25489|Ensembl:ENSG00000163872|HPRD:07652|Vega:OTTHUMG00000156898 |
| Gene type | protein-coding |
| Map location | 3q27.1 |
| Pascal p-value | 0.029 |
| Sherlock p-value | 0.133 |
| Fetal beta | 0.91 |
| DMG | 1 (# studies) |
| eGene | Meta |
Gene in Data Sources
| Gene set name | Method of gene set | Description | Info |
|---|---|---|---|
| CV:GWASdb | Genome-wide Association Studies | GWASdb records for schizophrenia | |
| CV:PGCnp | Genome-wide Association Study | GWAS | |
| DMG:Jaffe_2016 | Genome-wide DNA methylation analysis | This dataset includes 2,104 probes/CpGs associated with SZ patients (n=108) compared to 136 controls at Bonferroni-adjusted P < 0.05. | 1 |
Section I. Genetics and epigenetics annotation
 Differentially methylated gene
| Probe | Chromosome | Position | Nearest gene | P (dis) | Beta (dis) | FDR (dis) | Study |
|---|---|---|---|---|---|---|---|
| cg11368597 | 3 | 183415483 | YEATS2 | 1.21E-8 | -0.02 | 4.98E-6 | DMG:Jaffe_2016 |
Section II. Transcriptome annotation
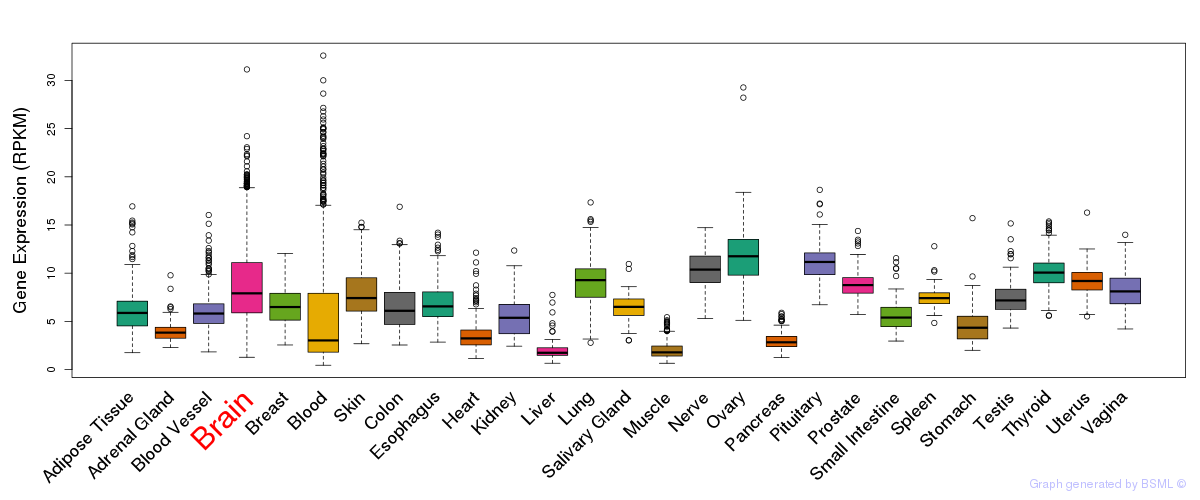
General gene expression (GTEx)
Gene expression during devlopment (BrainCloud)
Footnote:
A total of 269 time points ploted, with n=38 fetal samples (x=1:38). Each triangle represents one time point.
Gene expression of temporal and spatial changes (BrainSpan)
Footnote:
SC: sub-cortical regions; SM: sensory-motor regions; FC: frontal cortex; and TP: temporal-parietal cortex
ST1: fetal (13 - 26 postconception weeks), ST2: early infancy to late childhood (4 months to 11 years), and ST3: adolescence to adulthood (13 - 23 years)
The bar shown representes the lower 25% and upper 25% of the expression distribution.
Top co-expressed genes in brain regions
| Top 10 positively co-expressed genes | ||
| Gene | Pearson's Correlation | Spearman's Correlation |
| PDIA6 | 0.87 | 0.84 |
| DHX40 | 0.86 | 0.82 |
| C1orf124 | 0.86 | 0.80 |
| AGPAT5 | 0.85 | 0.84 |
| COPB2 | 0.85 | 0.82 |
| FAM114A2 | 0.84 | 0.77 |
| C1orf55 | 0.83 | 0.78 |
| SMU1 | 0.83 | 0.78 |
| TSN | 0.83 | 0.81 |
| TXNRD1 | 0.83 | 0.81 |
| Top 10 negatively co-expressed genes | ||
| Gene | Pearson's Correlation | Spearman's Correlation |
| MT-CO2 | -0.65 | -0.67 |
| AF347015.21 | -0.64 | -0.62 |
| AF347015.8 | -0.63 | -0.66 |
| AF347015.33 | -0.63 | -0.65 |
| AF347015.31 | -0.62 | -0.65 |
| MT-CYB | -0.61 | -0.64 |
| AF347015.27 | -0.61 | -0.63 |
| FXYD1 | -0.60 | -0.64 |
| AF347015.2 | -0.60 | -0.63 |
| AF347015.15 | -0.59 | -0.63 |
Section V. Pathway annotation
| Pathway name | Pathway size | # SZGR 2.0 genes in pathway | Info |
|---|---|---|---|
| KIM WT1 TARGETS DN | 459 | 276 | All SZGR 2.0 genes in this pathway |
| ELVIDGE HYPOXIA UP | 171 | 112 | All SZGR 2.0 genes in this pathway |
| ELVIDGE HYPOXIA BY DMOG UP | 130 | 85 | All SZGR 2.0 genes in this pathway |
| ELVIDGE HIF1A TARGETS DN | 91 | 58 | All SZGR 2.0 genes in this pathway |
| ELVIDGE HIF1A AND HIF2A TARGETS DN | 104 | 72 | All SZGR 2.0 genes in this pathway |
| DODD NASOPHARYNGEAL CARCINOMA DN | 1375 | 806 | All SZGR 2.0 genes in this pathway |
| FARMER BREAST CANCER APOCRINE VS BASAL | 330 | 217 | All SZGR 2.0 genes in this pathway |
| FARMER BREAST CANCER BASAL VS LULMINAL | 330 | 215 | All SZGR 2.0 genes in this pathway |
| YANG BREAST CANCER ESR1 DN | 25 | 15 | All SZGR 2.0 genes in this pathway |
| NUYTTEN NIPP1 TARGETS UP | 769 | 437 | All SZGR 2.0 genes in this pathway |
| BENPORATH ES CORE NINE CORRELATED | 100 | 68 | All SZGR 2.0 genes in this pathway |
| ACEVEDO LIVER CANCER UP | 973 | 570 | All SZGR 2.0 genes in this pathway |
| ACEVEDO LIVER TUMOR VS NORMAL ADJACENT TISSUE UP | 863 | 514 | All SZGR 2.0 genes in this pathway |
| SHEDDEN LUNG CANCER POOR SURVIVAL A6 | 456 | 285 | All SZGR 2.0 genes in this pathway |
| CAIRO HEPATOBLASTOMA CLASSES UP | 605 | 377 | All SZGR 2.0 genes in this pathway |
| KRIEG HYPOXIA NOT VIA KDM3A | 770 | 480 | All SZGR 2.0 genes in this pathway |
| SMIRNOV RESPONSE TO IR 2HR DN | 55 | 35 | All SZGR 2.0 genes in this pathway |