Gene Page: IPO9
Summary ?
| GeneID | 55705 |
| Symbol | IPO9 |
| Synonyms | Imp9 |
| Description | importin 9 |
| Reference | HGNC:HGNC:19425|Ensembl:ENSG00000198700|HPRD:17154|Vega:OTTHUMG00000035805 |
| Gene type | protein-coding |
| Map location | 1q32.1 |
| Fetal beta | 1.007 |
| DMG | 1 (# studies) |
Gene in Data Sources
| Gene set name | Method of gene set | Description | Info |
|---|---|---|---|
| CV:PGCnp | Genome-wide Association Study | GWAS | |
| DMG:Jaffe_2016 | Genome-wide DNA methylation analysis | This dataset includes 2,104 probes/CpGs associated with SZ patients (n=108) compared to 136 controls at Bonferroni-adjusted P < 0.05. | 1 |
Section I. Genetics and epigenetics annotation
 Differentially methylated gene
| Probe | Chromosome | Position | Nearest gene | P (dis) | Beta (dis) | FDR (dis) | Study |
|---|---|---|---|---|---|---|---|
| cg23687186 | 1 | 201798214 | IPO9 | 4.31E-8 | -0.012 | 1.19E-5 | DMG:Jaffe_2016 |
Section II. Transcriptome annotation
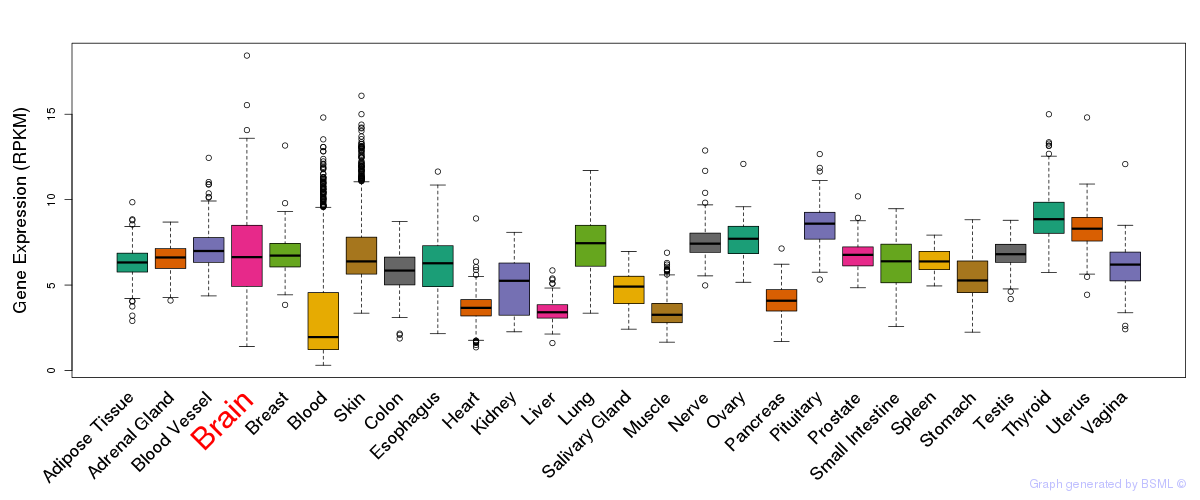
General gene expression (GTEx)
Gene expression during devlopment (BrainCloud)
Footnote:
A total of 269 time points ploted, with n=38 fetal samples (x=1:38). Each triangle represents one time point.
Gene expression of temporal and spatial changes (BrainSpan)
Footnote:
SC: sub-cortical regions; SM: sensory-motor regions; FC: frontal cortex; and TP: temporal-parietal cortex
ST1: fetal (13 - 26 postconception weeks), ST2: early infancy to late childhood (4 months to 11 years), and ST3: adolescence to adulthood (13 - 23 years)
The bar shown representes the lower 25% and upper 25% of the expression distribution.
Top co-expressed genes in brain regions
| Top 10 positively co-expressed genes | ||
| Gene | Pearson's Correlation | Spearman's Correlation |
| CES2 | 0.84 | 0.83 |
| ARHGDIA | 0.81 | 0.77 |
| TXNDC11 | 0.81 | 0.81 |
| AMPD2 | 0.81 | 0.80 |
| DNAJC11 | 0.80 | 0.81 |
| PCTK1 | 0.80 | 0.80 |
| UXS1 | 0.80 | 0.78 |
| MARK2 | 0.80 | 0.79 |
| DLGAP4 | 0.80 | 0.81 |
| SEPT5 | 0.80 | 0.75 |
| Top 10 negatively co-expressed genes | ||
| Gene | Pearson's Correlation | Spearman's Correlation |
| AF347015.21 | -0.63 | -0.54 |
| MT-CO2 | -0.60 | -0.51 |
| AF347015.31 | -0.59 | -0.51 |
| AL139819.3 | -0.58 | -0.57 |
| AF347015.2 | -0.57 | -0.48 |
| AF347015.8 | -0.56 | -0.49 |
| NOSTRIN | -0.55 | -0.46 |
| AF347015.33 | -0.55 | -0.46 |
| MT-CYB | -0.55 | -0.46 |
| AF347015.18 | -0.55 | -0.48 |
Section V. Pathway annotation
| Pathway name | Pathway size | # SZGR 2.0 genes in pathway | Info |
|---|---|---|---|
| ONKEN UVEAL MELANOMA UP | 783 | 507 | All SZGR 2.0 genes in this pathway |
| DODD NASOPHARYNGEAL CARCINOMA DN | 1375 | 806 | All SZGR 2.0 genes in this pathway |
| PUJANA ATM PCC NETWORK | 1442 | 892 | All SZGR 2.0 genes in this pathway |
| LIU NASOPHARYNGEAL CARCINOMA | 70 | 38 | All SZGR 2.0 genes in this pathway |
| WEI MIR34A TARGETS | 148 | 97 | All SZGR 2.0 genes in this pathway |
| RICKMAN TUMOR DIFFERENTIATED WELL VS POORLY UP | 236 | 139 | All SZGR 2.0 genes in this pathway |
| RICKMAN TUMOR DIFFERENTIATED MODERATELY VS POORLY DN | 15 | 8 | All SZGR 2.0 genes in this pathway |
| KOYAMA SEMA3B TARGETS DN | 411 | 249 | All SZGR 2.0 genes in this pathway |
| STARK PREFRONTAL CORTEX 22Q11 DELETION DN | 517 | 309 | All SZGR 2.0 genes in this pathway |
| ACEVEDO LIVER CANCER UP | 973 | 570 | All SZGR 2.0 genes in this pathway |
| ACEVEDO LIVER TUMOR VS NORMAL ADJACENT TISSUE UP | 863 | 514 | All SZGR 2.0 genes in this pathway |
| WANG TUMOR INVASIVENESS UP | 374 | 247 | All SZGR 2.0 genes in this pathway |
| WONG EMBRYONIC STEM CELL CORE | 335 | 193 | All SZGR 2.0 genes in this pathway |
| PILON KLF1 TARGETS DN | 1972 | 1213 | All SZGR 2.0 genes in this pathway |
| JOHNSTONE PARVB TARGETS 3 DN | 918 | 550 | All SZGR 2.0 genes in this pathway |