Gene Page: UTP6
Summary ?
| GeneID | 55813 |
| Symbol | UTP6 |
| Synonyms | C17orf40|HCA66 |
| Description | UTP6, small subunit processome component |
| Reference | HGNC:HGNC:18279|HPRD:11020| |
| Gene type | protein-coding |
| Map location | 17q11.2 |
| Pascal p-value | 0.093 |
| Sherlock p-value | 0.579 |
| Fetal beta | 1.037 |
| DMG | 1 (# studies) |
| eGene | Cerebellar Hemisphere |
| Support | Ascano FMRP targets |
Gene in Data Sources
| Gene set name | Method of gene set | Description | Info |
|---|---|---|---|
| CV:PGCnp | Genome-wide Association Study | GWAS | |
| DMG:Jaffe_2016 | Genome-wide DNA methylation analysis | This dataset includes 2,104 probes/CpGs associated with SZ patients (n=108) compared to 136 controls at Bonferroni-adjusted P < 0.05. | 1 |
Section I. Genetics and epigenetics annotation
 Differentially methylated gene
| Probe | Chromosome | Position | Nearest gene | P (dis) | Beta (dis) | FDR (dis) | Study |
|---|---|---|---|---|---|---|---|
| cg13453082 | 17 | 30228694 | UTP6 | 2.74E-8 | -0.014 | 8.65E-6 | DMG:Jaffe_2016 |
Section II. Transcriptome annotation
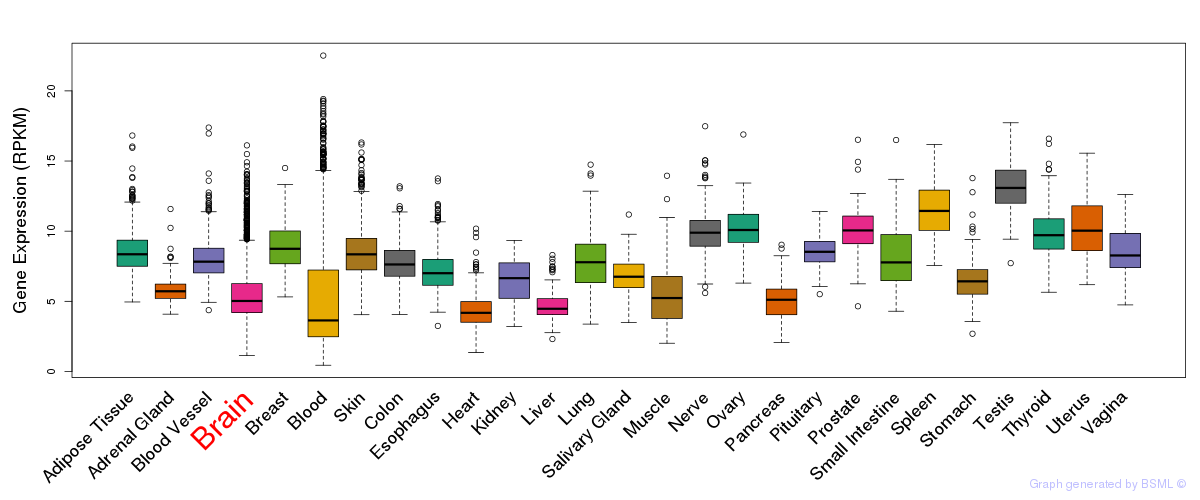
General gene expression (GTEx)
Gene expression during devlopment (BrainCloud)
Footnote:
A total of 269 time points ploted, with n=38 fetal samples (x=1:38). Each triangle represents one time point.
Gene expression of temporal and spatial changes (BrainSpan)
Footnote:
SC: sub-cortical regions; SM: sensory-motor regions; FC: frontal cortex; and TP: temporal-parietal cortex
ST1: fetal (13 - 26 postconception weeks), ST2: early infancy to late childhood (4 months to 11 years), and ST3: adolescence to adulthood (13 - 23 years)
The bar shown representes the lower 25% and upper 25% of the expression distribution.
Top co-expressed genes in brain regions
| Top 10 positively co-expressed genes | ||
| Gene | Pearson's Correlation | Spearman's Correlation |
| YWHAE | 0.92 | 0.93 |
| GLOD4 | 0.92 | 0.91 |
| TADA1L | 0.90 | 0.90 |
| MRPL3 | 0.90 | 0.88 |
| PTGES3 | 0.90 | 0.87 |
| UBA3 | 0.90 | 0.87 |
| MSL3 | 0.90 | 0.88 |
| EIF4E2 | 0.90 | 0.88 |
| COPS3 | 0.90 | 0.86 |
| C1orf149 | 0.90 | 0.89 |
| Top 10 negatively co-expressed genes | ||
| Gene | Pearson's Correlation | Spearman's Correlation |
| MT-CO2 | -0.80 | -0.78 |
| AF347015.31 | -0.77 | -0.77 |
| MT-CYB | -0.77 | -0.78 |
| AF347015.2 | -0.76 | -0.78 |
| AF347015.33 | -0.76 | -0.77 |
| AF347015.8 | -0.76 | -0.77 |
| AF347015.26 | -0.75 | -0.77 |
| HIGD1B | -0.72 | -0.75 |
| AF347015.15 | -0.72 | -0.76 |
| AF347015.9 | -0.71 | -0.78 |
Section V. Pathway annotation
| Pathway name | Pathway size | # SZGR 2.0 genes in pathway | Info |
|---|---|---|---|
| GAZDA DIAMOND BLACKFAN ANEMIA ERYTHROID UP | 25 | 18 | All SZGR 2.0 genes in this pathway |
| DODD NASOPHARYNGEAL CARCINOMA DN | 1375 | 806 | All SZGR 2.0 genes in this pathway |
| LASTOWSKA NEUROBLASTOMA COPY NUMBER UP | 181 | 108 | All SZGR 2.0 genes in this pathway |
| IVANOVA HEMATOPOIESIS EARLY PROGENITOR | 532 | 309 | All SZGR 2.0 genes in this pathway |
| MARSON BOUND BY FOXP3 STIMULATED | 1022 | 619 | All SZGR 2.0 genes in this pathway |
| MARSON BOUND BY FOXP3 UNSTIMULATED | 1229 | 713 | All SZGR 2.0 genes in this pathway |
| ZHANG TLX TARGETS 60HR DN | 277 | 166 | All SZGR 2.0 genes in this pathway |
| CAIRO HEPATOBLASTOMA CLASSES UP | 605 | 377 | All SZGR 2.0 genes in this pathway |
| PILON KLF1 TARGETS DN | 1972 | 1213 | All SZGR 2.0 genes in this pathway |
| BAKKER FOXO3 TARGETS DN | 187 | 109 | All SZGR 2.0 genes in this pathway |
| LEE BMP2 TARGETS DN | 882 | 538 | All SZGR 2.0 genes in this pathway |
| BILANGES SERUM SENSITIVE VIA TSC1 | 23 | 12 | All SZGR 2.0 genes in this pathway |
| WAKABAYASHI ADIPOGENESIS PPARG RXRA BOUND 8D | 882 | 506 | All SZGR 2.0 genes in this pathway |