Gene Page: BBS1
Summary ?
| GeneID | 582 |
| Symbol | BBS1 |
| Synonyms | BBS2L2 |
| Description | Bardet-Biedl syndrome 1 |
| Reference | MIM:209901|HGNC:HGNC:966|Ensembl:ENSG00000174483|Ensembl:ENSG00000256349|HPRD:01950|Vega:OTTHUMG00000167110Vega:OTTHUMG00000167719 |
| Gene type | protein-coding |
| Map location | 11q13 |
| Pascal p-value | 0.004 |
| Sherlock p-value | 0.302 |
| Fetal beta | -0.267 |
| DMG | 1 (# studies) |
| eGene | Frontal Cortex BA9 Meta |
Gene in Data Sources
| Gene set name | Method of gene set | Description | Info |
|---|---|---|---|
| CV:PGCnp | Genome-wide Association Study | GWAS | |
| DMG:Wockner_2014 | Genome-wide DNA methylation analysis | This dataset includes 4641 differentially methylated probes corresponding to 2929 unique genes between schizophrenia patients (n=24) and controls (n=24). | 1 |
| GO_Annotation | Mapping neuro-related keywords to Gene Ontology annotations | Hits with neuro-related keywords: 1 |
Section I. Genetics and epigenetics annotation
 Differentially methylated gene
| Probe | Chromosome | Position | Nearest gene | P (dis) | Beta (dis) | FDR (dis) | Study |
|---|---|---|---|---|---|---|---|
| cg04006266 | 11 | 66300458 | BBS1 | 1.284E-4 | 0.371 | 0.03 | DMG:Wockner_2014 |
Section II. Transcriptome annotation
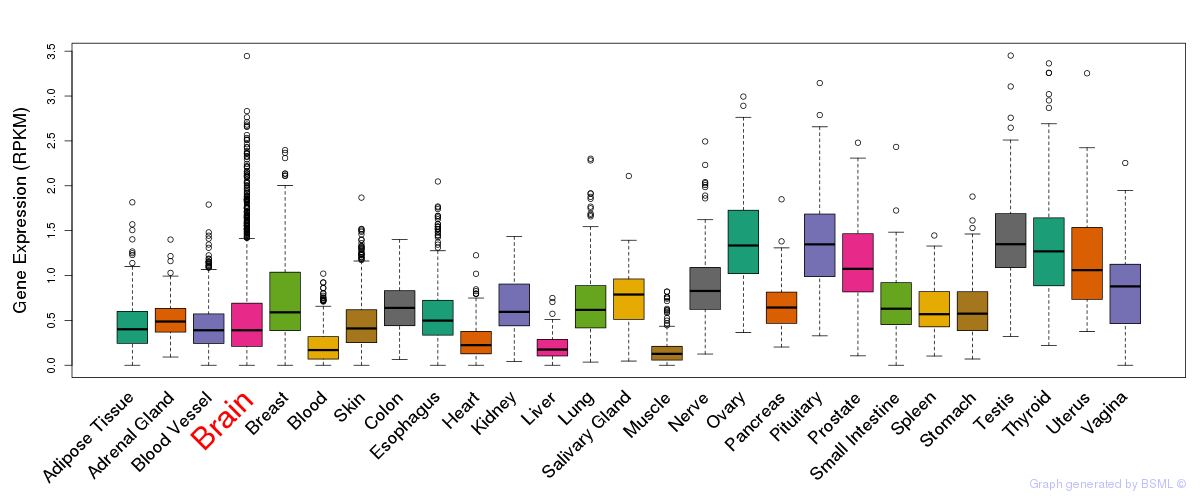
General gene expression (GTEx)
Gene expression during devlopment (BrainCloud)
Footnote:
A total of 269 time points ploted, with n=38 fetal samples (x=1:38). Each triangle represents one time point.
Gene expression of temporal and spatial changes (BrainSpan)
Footnote:
SC: sub-cortical regions; SM: sensory-motor regions; FC: frontal cortex; and TP: temporal-parietal cortex
ST1: fetal (13 - 26 postconception weeks), ST2: early infancy to late childhood (4 months to 11 years), and ST3: adolescence to adulthood (13 - 23 years)
The bar shown representes the lower 25% and upper 25% of the expression distribution.
Top co-expressed genes in brain regions
| Top 10 positively co-expressed genes | ||
| Gene | Pearson's Correlation | Spearman's Correlation |
| PRKAG1 | 0.78 | 0.73 |
| ADPGK | 0.78 | 0.80 |
| TFG | 0.78 | 0.80 |
| AZI2 | 0.78 | 0.79 |
| WDR61 | 0.77 | 0.73 |
| BPGM | 0.77 | 0.78 |
| CAPZB | 0.76 | 0.76 |
| POLR2C | 0.76 | 0.73 |
| PSMA1 | 0.76 | 0.75 |
| GMPR2 | 0.76 | 0.75 |
| Top 10 negatively co-expressed genes | ||
| Gene | Pearson's Correlation | Spearman's Correlation |
| MT-CYB | -0.62 | -0.61 |
| AF347015.2 | -0.61 | -0.60 |
| AF347015.8 | -0.61 | -0.62 |
| MT-CO2 | -0.61 | -0.60 |
| AF347015.31 | -0.60 | -0.61 |
| AF347015.21 | -0.58 | -0.59 |
| AF347015.27 | -0.58 | -0.62 |
| AF347015.18 | -0.58 | -0.64 |
| AF347015.15 | -0.58 | -0.59 |
| AF347015.26 | -0.57 | -0.60 |
Section III. Gene Ontology annotation
| Molecular function | GO term | Evidence | Neuro keywords | PubMed ID |
|---|---|---|---|---|
| GO:0005515 | protein binding | IPI | 17574030 |18000879 | |
| Biological process | GO term | Evidence | Neuro keywords | PubMed ID |
| GO:0035058 | sensory cilium biogenesis | IMP | neuron (GO term level: 10) | 17980398 |
| GO:0001895 | retina homeostasis | IMP | 17980398 | |
| GO:0050896 | response to stimulus | IEA | - | |
| GO:0045494 | photoreceptor cell maintenance | IMP | 17980398 | |
| Cellular component | GO term | Evidence | Neuro keywords | PubMed ID |
| GO:0034464 | BBSome | IDA | 17574030 |
Section V. Pathway annotation
| Pathway name | Pathway size | # SZGR 2.0 genes in pathway | Info |
|---|---|---|---|
| SOTIRIOU BREAST CANCER GRADE 1 VS 3 DN | 52 | 34 | All SZGR 2.0 genes in this pathway |
| GINESTIER BREAST CANCER ZNF217 AMPLIFIED DN | 335 | 193 | All SZGR 2.0 genes in this pathway |
| RODRIGUES THYROID CARCINOMA POORLY DIFFERENTIATED DN | 805 | 505 | All SZGR 2.0 genes in this pathway |
| RODRIGUES THYROID CARCINOMA ANAPLASTIC DN | 537 | 339 | All SZGR 2.0 genes in this pathway |
| LINDGREN BLADDER CANCER CLUSTER 1 UP | 121 | 71 | All SZGR 2.0 genes in this pathway |
| LINDGREN BLADDER CANCER CLUSTER 3 DN | 229 | 142 | All SZGR 2.0 genes in this pathway |
| PEREZ TP53 TARGETS | 1174 | 695 | All SZGR 2.0 genes in this pathway |
| FARMER BREAST CANCER APOCRINE VS BASAL | 330 | 217 | All SZGR 2.0 genes in this pathway |
| FARMER BREAST CANCER BASAL VS LULMINAL | 330 | 215 | All SZGR 2.0 genes in this pathway |
| NIKOLSKY BREAST CANCER 11Q12 Q14 AMPLICON | 158 | 93 | All SZGR 2.0 genes in this pathway |
| MATZUK SPERMATOZOA | 114 | 77 | All SZGR 2.0 genes in this pathway |
| MIKKELSEN ES ICP WITH H3K4ME3 | 718 | 401 | All SZGR 2.0 genes in this pathway |
| MIKKELSEN NPC ICP WITH H3K4ME3 | 445 | 257 | All SZGR 2.0 genes in this pathway |