Gene Page: BMP3
Summary ?
| GeneID | 651 |
| Symbol | BMP3 |
| Synonyms | BMP-3A |
| Description | bone morphogenetic protein 3 |
| Reference | MIM:112263|HGNC:HGNC:1070|Ensembl:ENSG00000152785|HPRD:00208|Vega:OTTHUMG00000130292 |
| Gene type | protein-coding |
| Map location | 4q21 |
| Pascal p-value | 0.04 |
| Fetal beta | 0.132 |
| DMG | 1 (# studies) |
| eGene | Cerebellar Hemisphere Cerebellum |
Gene in Data Sources
| Gene set name | Method of gene set | Description | Info |
|---|---|---|---|
| CV:PGCnp | Genome-wide Association Study | GWAS | |
| DMG:Jaffe_2016 | Genome-wide DNA methylation analysis | This dataset includes 2,104 probes/CpGs associated with SZ patients (n=108) compared to 136 controls at Bonferroni-adjusted P < 0.05. | 1 |
Section I. Genetics and epigenetics annotation
 Differentially methylated gene
| Probe | Chromosome | Position | Nearest gene | P (dis) | Beta (dis) | FDR (dis) | Study |
|---|---|---|---|---|---|---|---|
| cg01941671 | 4 | 81952099 | BMP3 | 7.03E-9 | -0.012 | 3.57E-6 | DMG:Jaffe_2016 |
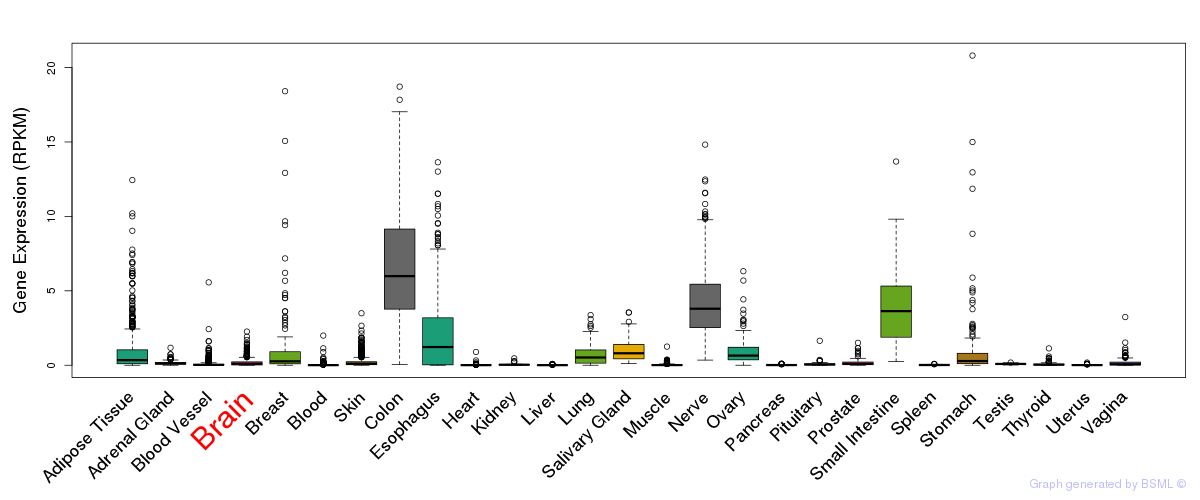
Section II. Transcriptome annotation
General gene expression (GTEx)
Gene expression during devlopment (BrainCloud)
Footnote:
A total of 269 time points ploted, with n=38 fetal samples (x=1:38). Each triangle represents one time point.
Gene expression of temporal and spatial changes (BrainSpan)
Footnote:
SC: sub-cortical regions; SM: sensory-motor regions; FC: frontal cortex; and TP: temporal-parietal cortex
ST1: fetal (13 - 26 postconception weeks), ST2: early infancy to late childhood (4 months to 11 years), and ST3: adolescence to adulthood (13 - 23 years)
The bar shown representes the lower 25% and upper 25% of the expression distribution.
Top co-expressed genes in brain regions
| Top 10 positively co-expressed genes | ||
| Gene | Pearson's Correlation | Spearman's Correlation |
| PHGDH | 0.87 | 0.85 |
| SOX21 | 0.87 | 0.89 |
| LRIG1 | 0.86 | 0.86 |
| RFX4 | 0.86 | 0.87 |
| M6PRBP1 | 0.85 | 0.85 |
| SLC12A4 | 0.83 | 0.84 |
| ASAP3 | 0.82 | 0.79 |
| PPAP2B | 0.82 | 0.90 |
| ABHD4 | 0.81 | 0.82 |
| FKBP10 | 0.81 | 0.76 |
| Top 10 negatively co-expressed genes | ||
| Gene | Pearson's Correlation | Spearman's Correlation |
| MEF2C | -0.42 | -0.41 |
| GPR22 | -0.39 | -0.42 |
| FAM49A | -0.38 | -0.36 |
| ARHGAP20 | -0.37 | -0.33 |
| FBXW7 | -0.36 | -0.33 |
| FAM19A1 | -0.36 | -0.32 |
| KLHL1 | -0.35 | -0.33 |
| SLC26A4 | -0.35 | -0.38 |
| SATB2 | -0.35 | -0.37 |
| NELL2 | -0.35 | -0.36 |
Section V. Pathway annotation
| Pathway name | Pathway size | # SZGR 2.0 genes in pathway | Info |
|---|---|---|---|
| SABATES COLORECTAL ADENOMA DN | 291 | 176 | All SZGR 2.0 genes in this pathway |
| SCHAEFFER PROSTATE DEVELOPMENT 48HR DN | 428 | 306 | All SZGR 2.0 genes in this pathway |
| BENPORATH SUZ12 TARGETS | 1038 | 678 | All SZGR 2.0 genes in this pathway |
| BENPORATH EED TARGETS | 1062 | 725 | All SZGR 2.0 genes in this pathway |
| SHEDDEN LUNG CANCER GOOD SURVIVAL A4 | 196 | 124 | All SZGR 2.0 genes in this pathway |
| HAN SATB1 TARGETS DN | 442 | 275 | All SZGR 2.0 genes in this pathway |
| MEISSNER BRAIN HCP WITH H3K4ME3 AND H3K27ME3 | 1069 | 729 | All SZGR 2.0 genes in this pathway |
| MEISSNER NPC HCP WITH H3K4ME2 | 491 | 319 | All SZGR 2.0 genes in this pathway |
| NABA SECRETED FACTORS | 344 | 197 | All SZGR 2.0 genes in this pathway |
| NABA MATRISOME ASSOCIATED | 753 | 411 | All SZGR 2.0 genes in this pathway |
| NABA MATRISOME | 1028 | 559 | All SZGR 2.0 genes in this pathway |