Gene Page: SP2
Summary ?
| GeneID | 6668 |
| Symbol | SP2 |
| Synonyms | - |
| Description | Sp2 transcription factor |
| Reference | MIM:601801|HGNC:HGNC:11207|Ensembl:ENSG00000167182|HPRD:03481|Vega:OTTHUMG00000150196 |
| Gene type | protein-coding |
| Map location | 17q21.32 |
| Pascal p-value | 0.129 |
| Sherlock p-value | 0.644 |
| Fetal beta | -0.08 |
| DMG | 1 (# studies) |
Gene in Data Sources
| Gene set name | Method of gene set | Description | Info |
|---|---|---|---|
| CV:PGCnp | Genome-wide Association Study | GWAS | |
| DMG:Jaffe_2016 | Genome-wide DNA methylation analysis | This dataset includes 2,104 probes/CpGs associated with SZ patients (n=108) compared to 136 controls at Bonferroni-adjusted P < 0.05. | 1 |
| DNM:Fromer_2014 | Whole Exome Sequencing analysis | This study reported a WES study of 623 schizophrenia trios, reporting DNMs using genomic DNA. |
Section I. Genetics and epigenetics annotation
 DNM table
| Gene | Chromosome | Position | Ref | Alt | Transcript | AA change | Mutation type | Sift | CG46 | Trait | Study |
|---|---|---|---|---|---|---|---|---|---|---|---|
| SP2 | chr17 | 46000639 | C | T | NM_003110 NM_003110 | . . | silent splice | Schizophrenia | DNM:Fromer_2014 |
 Differentially methylated gene
| Probe | Chromosome | Position | Nearest gene | P (dis) | Beta (dis) | FDR (dis) | Study |
|---|---|---|---|---|---|---|---|
| cg02372393 | 17 | 45973417 | SP2 | 2.38E-10 | -0.017 | 6.17E-7 | DMG:Jaffe_2016 |
Section II. Transcriptome annotation
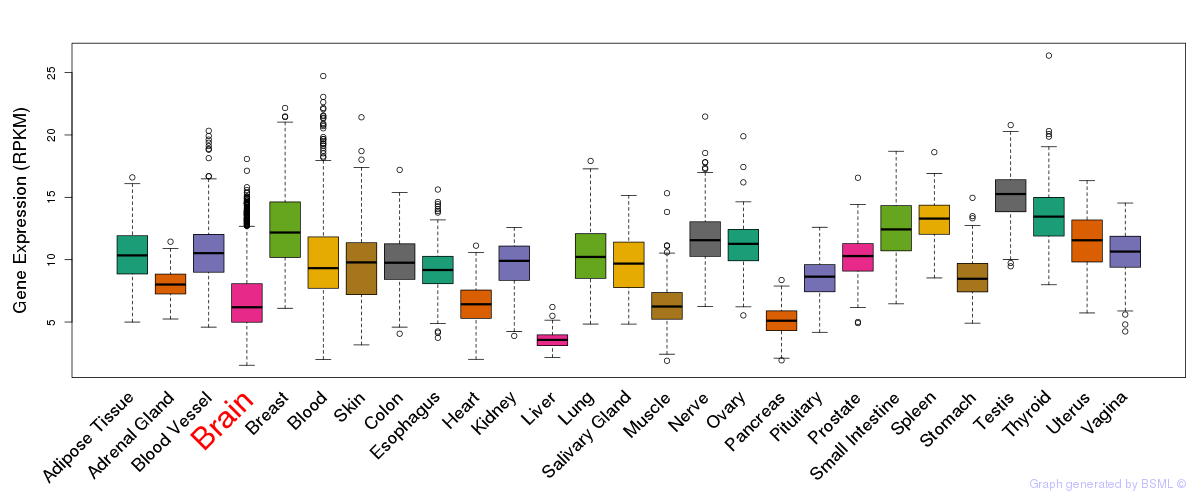
General gene expression (GTEx)

Gene expression during devlopment (BrainCloud)
Footnote:
A total of 269 time points ploted, with n=38 fetal samples (x=1:38). Each triangle represents one time point.
Gene expression of temporal and spatial changes (BrainSpan)
Footnote:
SC: sub-cortical regions; SM: sensory-motor regions; FC: frontal cortex; and TP: temporal-parietal cortex
ST1: fetal (13 - 26 postconception weeks), ST2: early infancy to late childhood (4 months to 11 years), and ST3: adolescence to adulthood (13 - 23 years)
The bar shown representes the lower 25% and upper 25% of the expression distribution.
Top co-expressed genes in brain regions
| Top 10 positively co-expressed genes | ||
| Gene | Pearson's Correlation | Spearman's Correlation |
| SLC4A1 | 0.83 | 0.66 |
| EPB42 | 0.78 | 0.65 |
| HEMGN | 0.76 | 0.65 |
| NFE2 | 0.74 | 0.50 |
| ALAS2 | 0.71 | 0.63 |
| GATA1 | 0.69 | 0.43 |
| HBM | 0.68 | 0.53 |
| ERAF | 0.65 | 0.61 |
| NSUN7 | 0.64 | 0.57 |
| HBG1 | 0.62 | 0.60 |
| Top 10 negatively co-expressed genes | ||
| Gene | Pearson's Correlation | Spearman's Correlation |
| C5orf53 | -0.39 | -0.59 |
| AIFM3 | -0.38 | -0.51 |
| HLA-F | -0.37 | -0.52 |
| FBXO2 | -0.37 | -0.52 |
| S100B | -0.37 | -0.55 |
| C1orf151 | -0.36 | -0.46 |
| CA4 | -0.36 | -0.50 |
| FXYD1 | -0.36 | -0.56 |
| PTGDS | -0.36 | -0.49 |
| MT-CO2 | -0.35 | -0.59 |
Section V. Pathway annotation
| Pathway name | Pathway size | # SZGR 2.0 genes in pathway | Info |
|---|---|---|---|
| SPIELMAN LYMPHOBLAST EUROPEAN VS ASIAN DN | 584 | 395 | All SZGR 2.0 genes in this pathway |
| PUJANA BRCA1 PCC NETWORK | 1652 | 1023 | All SZGR 2.0 genes in this pathway |
| PUJANA ATM PCC NETWORK | 1442 | 892 | All SZGR 2.0 genes in this pathway |
| BUYTAERT PHOTODYNAMIC THERAPY STRESS UP | 811 | 508 | All SZGR 2.0 genes in this pathway |
| BENPORATH NANOG TARGETS | 988 | 594 | All SZGR 2.0 genes in this pathway |
| BENPORATH SOX2 TARGETS | 734 | 436 | All SZGR 2.0 genes in this pathway |
| NIKOLSKY BREAST CANCER 17Q21 Q25 AMPLICON | 335 | 181 | All SZGR 2.0 genes in this pathway |
| RODWELL AGING KIDNEY NO BLOOD DN | 150 | 93 | All SZGR 2.0 genes in this pathway |
| CUI TCF21 TARGETS 2 DN | 830 | 547 | All SZGR 2.0 genes in this pathway |
| RODWELL AGING KIDNEY DN | 145 | 88 | All SZGR 2.0 genes in this pathway |
| WEIGEL OXIDATIVE STRESS BY HNE AND TBH | 60 | 42 | All SZGR 2.0 genes in this pathway |
| ACEVEDO LIVER CANCER UP | 973 | 570 | All SZGR 2.0 genes in this pathway |
| ACEVEDO LIVER TUMOR VS NORMAL ADJACENT TISSUE UP | 863 | 514 | All SZGR 2.0 genes in this pathway |
| WAKABAYASHI ADIPOGENESIS PPARG RXRA BOUND 8D | 882 | 506 | All SZGR 2.0 genes in this pathway |