Gene Page: CA7
Summary ?
| GeneID | 766 |
| Symbol | CA7 |
| Synonyms | CAVII |
| Description | carbonic anhydrase VII |
| Reference | MIM:114770|HGNC:HGNC:1381|Ensembl:ENSG00000168748|HPRD:00263|Vega:OTTHUMG00000137524 |
| Gene type | protein-coding |
| Map location | 16q22.1 |
| Pascal p-value | 0.003 |
| Fetal beta | -1.168 |
| DMG | 1 (# studies) |
Gene in Data Sources
| Gene set name | Method of gene set | Description | Info |
|---|---|---|---|
| CV:PGCnp | Genome-wide Association Study | GWAS | |
| DMG:Jaffe_2016 | Genome-wide DNA methylation analysis | This dataset includes 2,104 probes/CpGs associated with SZ patients (n=108) compared to 136 controls at Bonferroni-adjusted P < 0.05. | 1 |
Section I. Genetics and epigenetics annotation
 Differentially methylated gene
| Probe | Chromosome | Position | Nearest gene | P (dis) | Beta (dis) | FDR (dis) | Study |
|---|---|---|---|---|---|---|---|
| cg07497911 | 16 | 66878193 | CA7 | 2.65E-8 | -0.021 | 8.45E-6 | DMG:Jaffe_2016 |
Section II. Transcriptome annotation
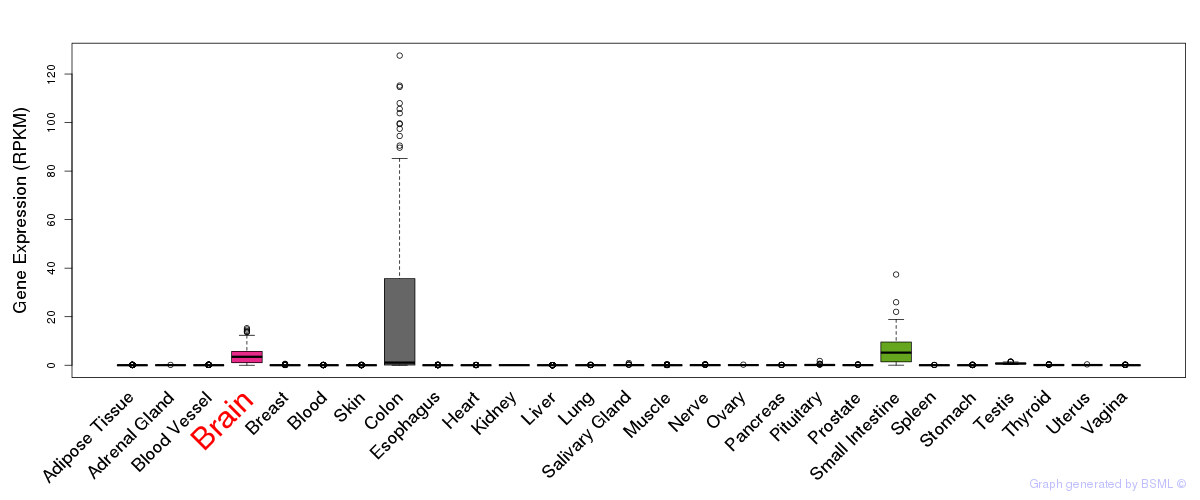
General gene expression (GTEx)
Gene expression during devlopment (BrainCloud)
Footnote:
A total of 269 time points ploted, with n=38 fetal samples (x=1:38). Each triangle represents one time point.
Gene expression of temporal and spatial changes (BrainSpan)
Footnote:
SC: sub-cortical regions; SM: sensory-motor regions; FC: frontal cortex; and TP: temporal-parietal cortex
ST1: fetal (13 - 26 postconception weeks), ST2: early infancy to late childhood (4 months to 11 years), and ST3: adolescence to adulthood (13 - 23 years)
The bar shown representes the lower 25% and upper 25% of the expression distribution.
Top co-expressed genes in brain regions
| Top 10 positively co-expressed genes | ||
| Gene | Pearson's Correlation | Spearman's Correlation |
| C5orf32 | 0.86 | 0.87 |
| CISD3 | 0.86 | 0.90 |
| PRSS3 | 0.86 | 0.91 |
| CCK | 0.85 | 0.83 |
| SHISA4 | 0.84 | 0.88 |
| ITPKA | 0.84 | 0.90 |
| SULT1A1 | 0.84 | 0.82 |
| ST6GALNAC6 | 0.83 | 0.84 |
| CA4 | 0.83 | 0.85 |
| ASPDH | 0.83 | 0.86 |
| Top 10 negatively co-expressed genes | ||
| Gene | Pearson's Correlation | Spearman's Correlation |
| KIAA1949 | -0.67 | -0.73 |
| THOC2 | -0.67 | -0.79 |
| TUBB2B | -0.66 | -0.75 |
| ZNF311 | -0.65 | -0.72 |
| TTC27 | -0.65 | -0.70 |
| SETDB1 | -0.65 | -0.68 |
| CCDC123 | -0.65 | -0.70 |
| ZNF326 | -0.65 | -0.76 |
| NKIRAS2 | -0.65 | -0.64 |
| ZNF551 | -0.65 | -0.71 |
Section V. Pathway annotation
| Pathway name | Pathway size | # SZGR 2.0 genes in pathway | Info |
|---|---|---|---|
| KEGG NITROGEN METABOLISM | 23 | 16 | All SZGR 2.0 genes in this pathway |
| REACTOME REVERSIBLE HYDRATION OF CARBON DIOXIDE | 12 | 6 | All SZGR 2.0 genes in this pathway |
| MULLIGHAN NPM1 MUTATED SIGNATURE 1 UP | 276 | 165 | All SZGR 2.0 genes in this pathway |
| MULLIGHAN NPM1 SIGNATURE 3 UP | 341 | 197 | All SZGR 2.0 genes in this pathway |
| SABATES COLORECTAL ADENOMA DN | 291 | 176 | All SZGR 2.0 genes in this pathway |
| MARTORIATI MDM4 TARGETS FETAL LIVER DN | 514 | 319 | All SZGR 2.0 genes in this pathway |
| HATADA METHYLATED IN LUNG CANCER UP | 390 | 236 | All SZGR 2.0 genes in this pathway |
| PUJANA BRCA1 PCC NETWORK | 1652 | 1023 | All SZGR 2.0 genes in this pathway |
| PUJANA ATM PCC NETWORK | 1442 | 892 | All SZGR 2.0 genes in this pathway |
| BENPORATH ES WITH H3K27ME3 | 1118 | 744 | All SZGR 2.0 genes in this pathway |
| SHEN SMARCA2 TARGETS DN | 357 | 212 | All SZGR 2.0 genes in this pathway |
| XU GH1 EXOGENOUS TARGETS UP | 85 | 50 | All SZGR 2.0 genes in this pathway |
| LEIN CEREBELLUM MARKERS | 85 | 47 | All SZGR 2.0 genes in this pathway |
| MEISSNER NPC HCP WITH H3K4ME2 AND H3K27ME3 | 349 | 234 | All SZGR 2.0 genes in this pathway |
| MIKKELSEN NPC HCP WITH H3K27ME3 | 341 | 243 | All SZGR 2.0 genes in this pathway |
| VANDESLUIS COMMD1 TARGETS GROUP 3 UP | 89 | 50 | All SZGR 2.0 genes in this pathway |