Gene Page: ZNF124
Summary ?
| GeneID | 7678 |
| Symbol | ZNF124 |
| Synonyms | HZF-16|HZF16|ZK7 |
| Description | zinc finger protein 124 |
| Reference | MIM:194631|HGNC:HGNC:12907|Ensembl:ENSG00000196418|HPRD:01936|Vega:OTTHUMG00000041112 |
| Gene type | protein-coding |
| Map location | 1q44 |
| Fetal beta | 2.143 |
| eGene | Caudate basal ganglia Cerebellar Hemisphere Cerebellum Cortex Frontal Cortex BA9 Hippocampus Hypothalamus Nucleus accumbens basal ganglia Putamen basal ganglia Meta |
Gene in Data Sources
| Gene set name | Method of gene set | Description | Info |
|---|---|---|---|
| CV:GWAScat | Genome-wide Association Studies | This data set includes 560 SNPs associated with schizophrenia. A total of 486 genes were mapped to these SNPs within 50kb. | |
| CV:PGCnp | Genome-wide Association Study | GWAS |
Section I. Genetics and epigenetics annotation
 eQTL annotation
| SNP ID | Chromosome | Position | eGene | Gene Entrez ID | pvalue | qvalue | TSS distance | eQTL type |
|---|---|---|---|---|---|---|---|---|
| rs10924924 | 1 | 247283320 | ZNF124 | ENSG00000196418.8 | 3.971E-7 | 0 | 51998 | gtex_brain_putamen_basal |
| rs12120049 | 1 | 247284268 | ZNF124 | ENSG00000196418.8 | 7.063E-8 | 0 | 51050 | gtex_brain_putamen_basal |
| rs4925701 | 1 | 247285147 | ZNF124 | ENSG00000196418.8 | 6.597E-8 | 0 | 50171 | gtex_brain_putamen_basal |
| rs4925703 | 1 | 247285224 | ZNF124 | ENSG00000196418.8 | 6.627E-8 | 0 | 50094 | gtex_brain_putamen_basal |
| rs12058648 | 1 | 247286645 | ZNF124 | ENSG00000196418.8 | 1.94E-8 | 0 | 48673 | gtex_brain_putamen_basal |
| rs3901383 | 1 | 247287260 | ZNF124 | ENSG00000196418.8 | 2.512E-7 | 0 | 48058 | gtex_brain_putamen_basal |
| rs6700824 | 1 | 247287601 | ZNF124 | ENSG00000196418.8 | 2.541E-10 | 0 | 47717 | gtex_brain_putamen_basal |
| rs4925710 | 1 | 247288022 | ZNF124 | ENSG00000196418.8 | 2.598E-10 | 0 | 47296 | gtex_brain_putamen_basal |
| rs4925711 | 1 | 247288048 | ZNF124 | ENSG00000196418.8 | 7.174E-9 | 0 | 47270 | gtex_brain_putamen_basal |
| rs4925715 | 1 | 247288469 | ZNF124 | ENSG00000196418.8 | 2.732E-10 | 0 | 46849 | gtex_brain_putamen_basal |
| rs149193366 | 1 | 247288796 | ZNF124 | ENSG00000196418.8 | 1.388E-7 | 0 | 46522 | gtex_brain_putamen_basal |
| rs12130663 | 1 | 247288954 | ZNF124 | ENSG00000196418.8 | 2.745E-7 | 0 | 46364 | gtex_brain_putamen_basal |
| rs202028500 | 1 | 247288975 | ZNF124 | ENSG00000196418.8 | 5.277E-7 | 0 | 46343 | gtex_brain_putamen_basal |
| rs140804926 | 1 | 247289279 | ZNF124 | ENSG00000196418.8 | 1.67E-8 | 0 | 46039 | gtex_brain_putamen_basal |
| rs10158232 | 1 | 247289429 | ZNF124 | ENSG00000196418.8 | 1.927E-9 | 0 | 45889 | gtex_brain_putamen_basal |
| rs10159377 | 1 | 247289430 | ZNF124 | ENSG00000196418.8 | 1.924E-9 | 0 | 45888 | gtex_brain_putamen_basal |
| rs6700358 | 1 | 247297018 | ZNF124 | ENSG00000196418.8 | 6.13E-7 | 0 | 38300 | gtex_brain_putamen_basal |
| rs6688822 | 1 | 247297502 | ZNF124 | ENSG00000196418.8 | 6.158E-7 | 0 | 37816 | gtex_brain_putamen_basal |
| rs138800470 | 1 | 247298525 | ZNF124 | ENSG00000196418.8 | 6.53E-7 | 0 | 36793 | gtex_brain_putamen_basal |
| rs2890339 | 1 | 247298975 | ZNF124 | ENSG00000196418.8 | 6.01E-7 | 0 | 36343 | gtex_brain_putamen_basal |
| rs9803983 | 1 | 247300056 | ZNF124 | ENSG00000196418.8 | 6.088E-7 | 0 | 35262 | gtex_brain_putamen_basal |
| rs9803828 | 1 | 247300208 | ZNF124 | ENSG00000196418.8 | 6.097E-7 | 0 | 35110 | gtex_brain_putamen_basal |
| rs12076177 | 1 | 247300668 | ZNF124 | ENSG00000196418.8 | 6.137E-7 | 0 | 34650 | gtex_brain_putamen_basal |
| rs12076273 | 1 | 247300862 | ZNF124 | ENSG00000196418.8 | 6.149E-7 | 0 | 34456 | gtex_brain_putamen_basal |
| rs6659254 | 1 | 247302314 | ZNF124 | ENSG00000196418.8 | 1.489E-8 | 0 | 33004 | gtex_brain_putamen_basal |
| rs9793102 | 1 | 247323260 | ZNF124 | ENSG00000196418.8 | 2.591E-8 | 0 | 12058 | gtex_brain_putamen_basal |
| rs4925587 | 1 | 247333729 | ZNF124 | ENSG00000196418.8 | 2.879E-7 | 0 | 1589 | gtex_brain_putamen_basal |
Section II. Transcriptome annotation
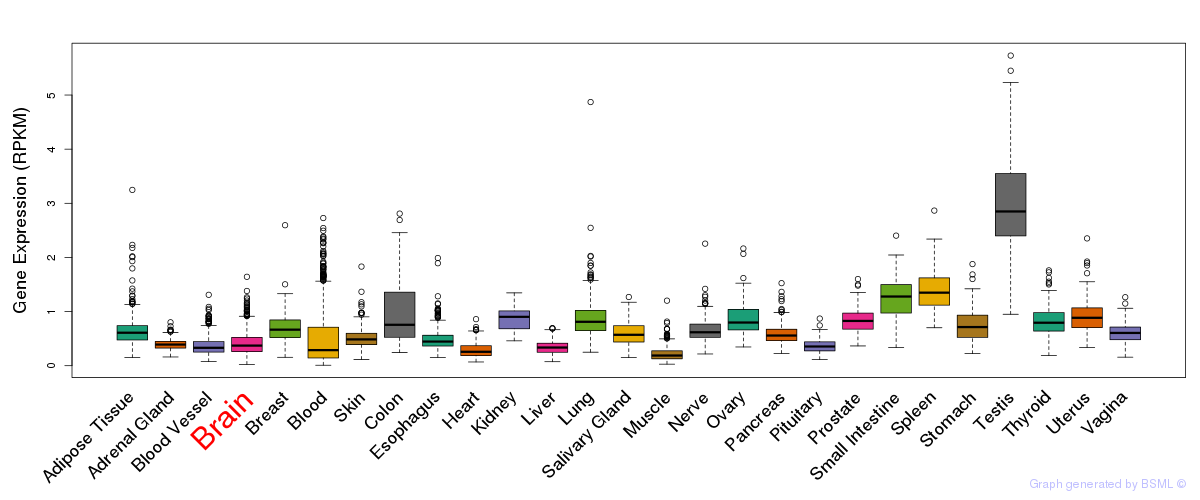
General gene expression (GTEx)
Gene expression during devlopment (BrainCloud)
Footnote:
A total of 269 time points ploted, with n=38 fetal samples (x=1:38). Each triangle represents one time point.
Gene expression of temporal and spatial changes (BrainSpan)
Footnote:
SC: sub-cortical regions; SM: sensory-motor regions; FC: frontal cortex; and TP: temporal-parietal cortex
ST1: fetal (13 - 26 postconception weeks), ST2: early infancy to late childhood (4 months to 11 years), and ST3: adolescence to adulthood (13 - 23 years)
The bar shown representes the lower 25% and upper 25% of the expression distribution.
No co-expressed genes in brain regions
Section V. Pathway annotation
| Pathway name | Pathway size | # SZGR 2.0 genes in pathway | Info |
|---|---|---|---|
| HOLLMANN APOPTOSIS VIA CD40 DN | 267 | 178 | All SZGR 2.0 genes in this pathway |
| DIAZ CHRONIC MEYLOGENOUS LEUKEMIA DN | 116 | 79 | All SZGR 2.0 genes in this pathway |
| DODD NASOPHARYNGEAL CARCINOMA DN | 1375 | 806 | All SZGR 2.0 genes in this pathway |
| FLECHNER BIOPSY KIDNEY TRANSPLANT REJECTED VS OK DN | 546 | 351 | All SZGR 2.0 genes in this pathway |
| LI WILMS TUMOR VS FETAL KIDNEY 1 UP | 182 | 119 | All SZGR 2.0 genes in this pathway |
| BACOLOD RESISTANCE TO ALKYLATING AGENTS DN | 60 | 45 | All SZGR 2.0 genes in this pathway |
| SMID BREAST CANCER BASAL UP | 648 | 398 | All SZGR 2.0 genes in this pathway |
| BROWNE HCMV INFECTION 30MIN DN | 150 | 99 | All SZGR 2.0 genes in this pathway |
| ZWANG TRANSIENTLY UP BY 1ST EGF PULSE ONLY | 1839 | 928 | All SZGR 2.0 genes in this pathway |