Gene Page: FAM65A
Summary ?
| GeneID | 79567 |
| Symbol | FAM65A |
| Synonyms | - |
| Description | family with sequence similarity 65 member A |
| Reference | HGNC:HGNC:25836|Ensembl:ENSG00000039523|HPRD:08586|Vega:OTTHUMG00000137536 |
| Gene type | protein-coding |
| Map location | 16q22.1 |
| Pascal p-value | 0.003 |
| Sherlock p-value | 0.432 |
| Fetal beta | -0.3 |
| DMG | 1 (# studies) |
| eGene | Myers' cis & trans |
| Support | CompositeSet Darnell FMRP targets |
Gene in Data Sources
| Gene set name | Method of gene set | Description | Info |
|---|---|---|---|
| CV:PGCnp | Genome-wide Association Study | GWAS | |
| DMG:Wockner_2014 | Genome-wide DNA methylation analysis | This dataset includes 4641 differentially methylated probes corresponding to 2929 unique genes between schizophrenia patients (n=24) and controls (n=24). | 1 |
Section I. Genetics and epigenetics annotation
 Differentially methylated gene
| Probe | Chromosome | Position | Nearest gene | P (dis) | Beta (dis) | FDR (dis) | Study |
|---|---|---|---|---|---|---|---|
| cg04185041 | 16 | 67564545 | FAM65A | 2.263E-4 | 0.361 | 0.036 | DMG:Wockner_2014 |
eQTL annotation
| SNP ID | Chromosome | Position | eGene | Gene Entrez ID | pvalue | qvalue | TSS distance | eQTL type |
|---|---|---|---|---|---|---|---|---|
| rs10516594 | chr4 | 114237566 | FAM65A | 79567 | 0.15 | trans | ||
| rs4497566 | chr13 | 51694324 | FAM65A | 79567 | 0.15 | trans |
Section II. Transcriptome annotation
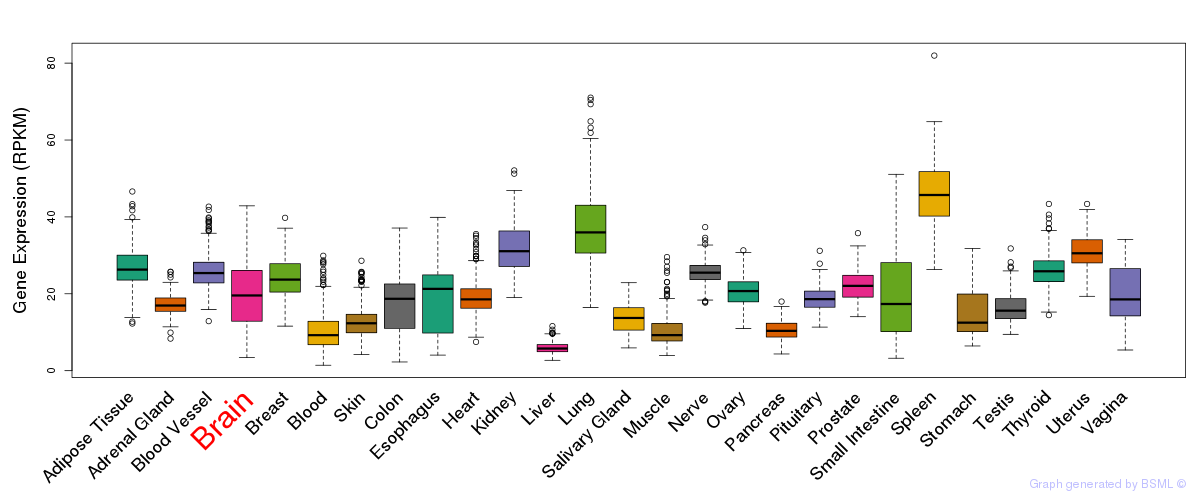
General gene expression (GTEx)
Gene expression during devlopment (BrainCloud)
Footnote:
A total of 269 time points ploted, with n=38 fetal samples (x=1:38). Each triangle represents one time point.
Gene expression of temporal and spatial changes (BrainSpan)
Footnote:
SC: sub-cortical regions; SM: sensory-motor regions; FC: frontal cortex; and TP: temporal-parietal cortex
ST1: fetal (13 - 26 postconception weeks), ST2: early infancy to late childhood (4 months to 11 years), and ST3: adolescence to adulthood (13 - 23 years)
The bar shown representes the lower 25% and upper 25% of the expression distribution.
Top co-expressed genes in brain regions
| Top 10 positively co-expressed genes | ||
| Gene | Pearson's Correlation | Spearman's Correlation |
| KDM5B | 0.98 | 0.95 |
| PBRM1 | 0.97 | 0.96 |
| C9orf97 | 0.97 | 0.94 |
| ATF7IP | 0.97 | 0.97 |
| CEP170 | 0.97 | 0.94 |
| NUP160 | 0.96 | 0.94 |
| SLAIN2 | 0.96 | 0.94 |
| RBM12 | 0.96 | 0.96 |
| C2orf44 | 0.96 | 0.92 |
| ZBTB5 | 0.96 | 0.95 |
| Top 10 negatively co-expressed genes | ||
| Gene | Pearson's Correlation | Spearman's Correlation |
| C5orf53 | -0.71 | -0.79 |
| HLA-F | -0.70 | -0.78 |
| AIFM3 | -0.69 | -0.78 |
| PTH1R | -0.68 | -0.75 |
| S100B | -0.67 | -0.83 |
| FBXO2 | -0.67 | -0.64 |
| FXYD1 | -0.67 | -0.89 |
| AF347015.31 | -0.67 | -0.87 |
| TSC22D4 | -0.67 | -0.78 |
| TNFSF12 | -0.66 | -0.67 |
Section V. Pathway annotation
| Pathway name | Pathway size | # SZGR 2.0 genes in pathway | Info |
|---|---|---|---|
| FULCHER INFLAMMATORY RESPONSE LECTIN VS LPS DN | 463 | 290 | All SZGR 2.0 genes in this pathway |
| WANG CLIM2 TARGETS UP | 269 | 146 | All SZGR 2.0 genes in this pathway |
| MULLIGHAN MLL SIGNATURE 1 DN | 242 | 165 | All SZGR 2.0 genes in this pathway |
| MULLIGHAN MLL SIGNATURE 2 DN | 281 | 186 | All SZGR 2.0 genes in this pathway |
| KIM WT1 TARGETS 8HR UP | 164 | 122 | All SZGR 2.0 genes in this pathway |
| KIM WT1 TARGETS 12HR UP | 162 | 116 | All SZGR 2.0 genes in this pathway |
| GRAESSMANN APOPTOSIS BY DOXORUBICIN UP | 1142 | 669 | All SZGR 2.0 genes in this pathway |
| GRAESSMANN RESPONSE TO MC AND DOXORUBICIN UP | 612 | 367 | All SZGR 2.0 genes in this pathway |
| BUYTAERT PHOTODYNAMIC THERAPY STRESS UP | 811 | 508 | All SZGR 2.0 genes in this pathway |
| BENPORATH SUZ12 TARGETS | 1038 | 678 | All SZGR 2.0 genes in this pathway |
| BROWN MYELOID CELL DEVELOPMENT DN | 129 | 86 | All SZGR 2.0 genes in this pathway |
| CUI TCF21 TARGETS 2 DN | 830 | 547 | All SZGR 2.0 genes in this pathway |
| CREIGHTON ENDOCRINE THERAPY RESISTANCE 5 | 482 | 296 | All SZGR 2.0 genes in this pathway |
| MASSARWEH TAMOXIFEN RESISTANCE UP | 578 | 341 | All SZGR 2.0 genes in this pathway |
| ZHANG TLX TARGETS 60HR UP | 293 | 203 | All SZGR 2.0 genes in this pathway |
| CHEN METABOLIC SYNDROM NETWORK | 1210 | 725 | All SZGR 2.0 genes in this pathway |
| MIKKELSEN ES ICP WITH H3K4ME3 | 718 | 401 | All SZGR 2.0 genes in this pathway |
| JOHNSTONE PARVB TARGETS 3 UP | 430 | 288 | All SZGR 2.0 genes in this pathway |
| BRUINS UVC RESPONSE VIA TP53 GROUP A | 898 | 516 | All SZGR 2.0 genes in this pathway |
| WAKABAYASHI ADIPOGENESIS PPARG RXRA BOUND 8D | 882 | 506 | All SZGR 2.0 genes in this pathway |
| PHONG TNF RESPONSE NOT VIA P38 | 337 | 236 | All SZGR 2.0 genes in this pathway |
| VANOEVELEN MYOGENESIS SIN3A TARGETS | 220 | 133 | All SZGR 2.0 genes in this pathway |