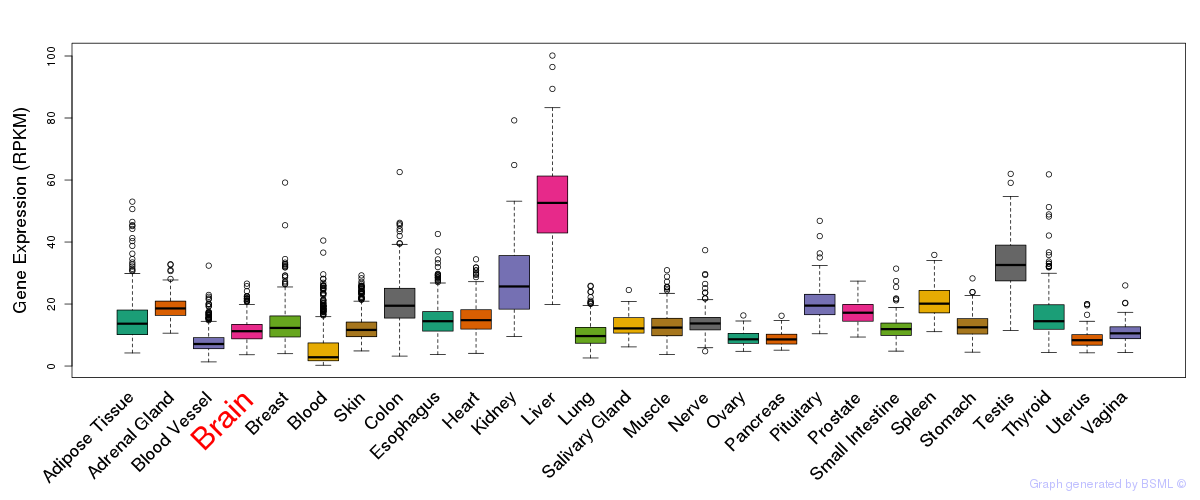
Gene Page: ISOC2
Summary ?
| GeneID | 79763 |
| Symbol | ISOC2 |
| Synonyms | - |
| Description | isochorismatase domain containing 2 |
| Reference | MIM:612928|HGNC:HGNC:26278|Ensembl:ENSG00000063241|HPRD:08030|Vega:OTTHUMG00000180830 |
| Gene type | protein-coding |
| Map location | 19q13.42 |
| Pascal p-value | 0.403 |
| Sherlock p-value | 0.975 |
| Fetal beta | -0.944 |
| DMG | 1 (# studies) |
| eGene | Meta |
Gene in Data Sources
| Gene set name | Method of gene set | Description | Info |
|---|---|---|---|
| CV:PGCnp | Genome-wide Association Study | GWAS | |
| DMG:Jaffe_2016 | Genome-wide DNA methylation analysis | This dataset includes 2,104 probes/CpGs associated with SZ patients (n=108) compared to 136 controls at Bonferroni-adjusted P < 0.05. | 1 |
| Network | Shortest path distance of core genes in the Human protein-protein interaction network | Contribution to shortest path in PPI network: 0.05 |
Section I. Genetics and epigenetics annotation
 Differentially methylated gene
| Probe | Chromosome | Position | Nearest gene | P (dis) | Beta (dis) | FDR (dis) | Study |
|---|---|---|---|---|---|---|---|
| cg04504956 | 19 | 55963317 | ISOC2 | 2.5E-8 | -0.02 | 8.03E-6 | DMG:Jaffe_2016 |
Section II. Transcriptome annotation
General gene expression (GTEx)

Gene expression during devlopment (BrainCloud)
Footnote:
A total of 269 time points ploted, with n=38 fetal samples (x=1:38). Each triangle represents one time point.
Gene expression of temporal and spatial changes (BrainSpan)
Footnote:
SC: sub-cortical regions; SM: sensory-motor regions; FC: frontal cortex; and TP: temporal-parietal cortex
ST1: fetal (13 - 26 postconception weeks), ST2: early infancy to late childhood (4 months to 11 years), and ST3: adolescence to adulthood (13 - 23 years)
The bar shown representes the lower 25% and upper 25% of the expression distribution.
Top co-expressed genes in brain regions
| Top 10 positively co-expressed genes | ||
| Gene | Pearson's Correlation | Spearman's Correlation |
| CR381670.2 | 0.39 | 0.07 |
| PAPOLB | 0.38 | 0.21 |
| DNAH8 | 0.36 | 0.14 |
| RP11-413E6.1 | 0.36 | 0.08 |
| XIRP1 | 0.35 | 0.10 |
| RP1L1 | 0.33 | 0.29 |
| CES3 | 0.32 | 0.29 |
| FBXW12 | 0.31 | 0.26 |
| NUP210L | 0.30 | 0.13 |
| C12orf54 | 0.30 | 0.15 |
| Top 10 negatively co-expressed genes | ||
| Gene | Pearson's Correlation | Spearman's Correlation |
| GNG11 | -0.21 | -0.28 |
| IL32 | -0.21 | -0.26 |
| CLEC3B | -0.20 | -0.23 |
| AC131097.1 | -0.19 | -0.21 |
| MRPL41 | -0.19 | -0.19 |
| CLDN5 | -0.19 | -0.21 |
| HIGD1B | -0.18 | -0.22 |
| AF347015.21 | -0.18 | -0.29 |
| BTBD17 | -0.18 | -0.21 |
| METRN | -0.17 | -0.25 |
Section III. Gene Ontology annotation
| Molecular function | GO term | Evidence | Neuro keywords | PubMed ID |
|---|---|---|---|---|
| GO:0003824 | catalytic activity | IEA | - | |
| GO:0005515 | protein binding | IPI | 15231747 | |
| Biological process | GO term | Evidence | Neuro keywords | PubMed ID |
| GO:0008152 | metabolic process | IEA | - | |
| GO:0031648 | protein destabilization | IMP | 17658461 | |
| Cellular component | GO term | Evidence | Neuro keywords | PubMed ID |
| GO:0005634 | nucleus | IDA | 17658461 | |
| GO:0005737 | cytoplasm | IDA | 17658461 | |
| GO:0005739 | mitochondrion | IEA | - |
Section V. Pathway annotation
| Pathway name | Pathway size | # SZGR 2.0 genes in pathway | Info |
|---|---|---|---|
| HOOI ST7 TARGETS UP | 94 | 57 | All SZGR 2.0 genes in this pathway |
| MULLIGHAN MLL SIGNATURE 2 UP | 418 | 263 | All SZGR 2.0 genes in this pathway |
| BIDUS METASTASIS DN | 161 | 93 | All SZGR 2.0 genes in this pathway |
| DAIRKEE TERT TARGETS UP | 380 | 213 | All SZGR 2.0 genes in this pathway |
| BUYTAERT PHOTODYNAMIC THERAPY STRESS DN | 637 | 377 | All SZGR 2.0 genes in this pathway |
| BENPORATH NANOG TARGETS | 988 | 594 | All SZGR 2.0 genes in this pathway |
| DOUGLAS BMI1 TARGETS UP | 566 | 371 | All SZGR 2.0 genes in this pathway |
| KRIGE RESPONSE TO TOSEDOSTAT 6HR UP | 953 | 554 | All SZGR 2.0 genes in this pathway |
| KRIGE RESPONSE TO TOSEDOSTAT 24HR DN | 1011 | 592 | All SZGR 2.0 genes in this pathway |
| STEIN ESRRA TARGETS UP | 388 | 234 | All SZGR 2.0 genes in this pathway |
| SHEDDEN LUNG CANCER GOOD SURVIVAL A12 | 317 | 177 | All SZGR 2.0 genes in this pathway |
| STEIN ESRRA TARGETS | 535 | 325 | All SZGR 2.0 genes in this pathway |
| HIRSCH CELLULAR TRANSFORMATION SIGNATURE DN | 103 | 67 | All SZGR 2.0 genes in this pathway |
| LU EZH2 TARGETS UP | 295 | 155 | All SZGR 2.0 genes in this pathway |
Section VI. microRNA annotation
| miRNA family | Target position | miRNA ID | miRNA seq | ||
|---|---|---|---|---|---|
| UTR start | UTR end | Match method | |||
| miR-33 | 166 | 172 | 1A | hsa-miR-33 | GUGCAUUGUAGUUGCAUUG |
| hsa-miR-33b | GUGCAUUGCUGUUGCAUUGCA | ||||
- SZ: miRNAs which differentially expressed in brain cortex of schizophrenia patients comparing with control samples using microarray. Click here to see the list of SZ related miRNAs.
- Brain: miRNAs which are expressed in brain based on miRNA microarray expression studies. Click here to see the list of brain related miRNAs.