Gene Page: DNAJA3
Summary ?
| GeneID | 9093 |
| Symbol | DNAJA3 |
| Synonyms | HCA57|TID1|hTID-1 |
| Description | DnaJ heat shock protein family (Hsp40) member A3 |
| Reference | MIM:608382|HGNC:HGNC:11808|Ensembl:ENSG00000103423|HPRD:09758|Vega:OTTHUMG00000129470 |
| Gene type | protein-coding |
| Map location | 16p13.3 |
| Pascal p-value | 2.3E-6 |
| Sherlock p-value | 0.383 |
| Fetal beta | 0.117 |
| eGene | Cerebellum Myers' cis & trans |
| Support | G2Cdb.human_BAYES-COLLINS-HUMAN-PSD-FULL G2Cdb.human_mitochondria |
Gene in Data Sources
| Gene set name | Method of gene set | Description | Info |
|---|---|---|---|
| CV:GWASdb | Genome-wide Association Studies | GWASdb records for schizophrenia | |
| CV:PGCnp | Genome-wide Association Study | GWAS | |
| Network | Shortest path distance of core genes in the Human protein-protein interaction network | Contribution to shortest path in PPI network: 0.0426 |
Section I. Genetics and epigenetics annotation
 eQTL annotation
| SNP ID | Chromosome | Position | eGene | Gene Entrez ID | pvalue | qvalue | TSS distance | eQTL type |
|---|---|---|---|---|---|---|---|---|
| rs9571716 | chr13 | 67711344 | DNAJA3 | 9093 | 0.19 | trans |
Section II. Transcriptome annotation
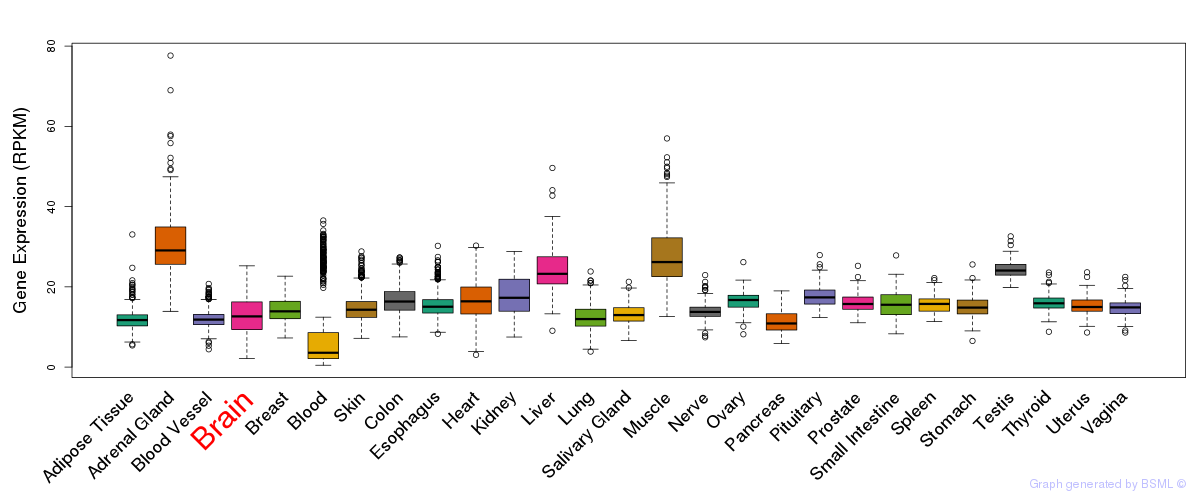
General gene expression (GTEx)
Gene expression during devlopment (BrainCloud)
Footnote:
A total of 269 time points ploted, with n=38 fetal samples (x=1:38). Each triangle represents one time point.
Gene expression of temporal and spatial changes (BrainSpan)
Footnote:
SC: sub-cortical regions; SM: sensory-motor regions; FC: frontal cortex; and TP: temporal-parietal cortex
ST1: fetal (13 - 26 postconception weeks), ST2: early infancy to late childhood (4 months to 11 years), and ST3: adolescence to adulthood (13 - 23 years)
The bar shown representes the lower 25% and upper 25% of the expression distribution.
Top co-expressed genes in brain regions
| Top 10 positively co-expressed genes | ||
| Gene | Pearson's Correlation | Spearman's Correlation |
| MOAP1 | 0.92 | 0.90 |
| NAPG | 0.90 | 0.90 |
| EPS15 | 0.90 | 0.90 |
| ARL8B | 0.90 | 0.90 |
| MAPK9 | 0.90 | 0.90 |
| PLEKHB2 | 0.90 | 0.90 |
| VPS36 | 0.89 | 0.87 |
| IDH3A | 0.89 | 0.89 |
| DNAJB14 | 0.89 | 0.92 |
| RAB6B | 0.89 | 0.89 |
| Top 10 negatively co-expressed genes | ||
| Gene | Pearson's Correlation | Spearman's Correlation |
| RAB34 | -0.52 | -0.57 |
| EFEMP2 | -0.51 | -0.56 |
| C1orf61 | -0.49 | -0.57 |
| IL32 | -0.47 | -0.34 |
| AF347015.18 | -0.46 | -0.34 |
| AL022328.1 | -0.46 | -0.50 |
| AP002478.3 | -0.46 | -0.44 |
| IRF7 | -0.45 | -0.56 |
| GATSL3 | -0.45 | -0.47 |
| AF347015.21 | -0.45 | -0.28 |
Section III. Gene Ontology annotation
| Molecular function | GO term | Evidence | Neuro keywords | PubMed ID |
|---|---|---|---|---|
| GO:0008270 | zinc ion binding | IEA | - | |
| GO:0031072 | heat shock protein binding | IEA | - | |
| GO:0051082 | unfolded protein binding | TAS | 9683573 | |
| GO:0046872 | metal ion binding | IEA | - | |
| Biological process | GO term | Evidence | Neuro keywords | PubMed ID |
| GO:0006457 | protein folding | TAS | 9683573 | |
| GO:0042981 | regulation of apoptosis | NAS | 12879007 | |
| Cellular component | GO term | Evidence | Neuro keywords | PubMed ID |
| GO:0005739 | mitochondrion | IEA | - | |
| GO:0005759 | mitochondrial matrix | IDA | 11719219 |
Section V. Pathway annotation
| Pathway name | Pathway size | # SZGR 2.0 genes in pathway | Info |
|---|---|---|---|
| BIOCARTA TID PATHWAY | 19 | 15 | All SZGR 2.0 genes in this pathway |
| PID TRKR PATHWAY | 62 | 48 | All SZGR 2.0 genes in this pathway |
| DIAZ CHRONIC MEYLOGENOUS LEUKEMIA UP | 1382 | 904 | All SZGR 2.0 genes in this pathway |
| DODD NASOPHARYNGEAL CARCINOMA DN | 1375 | 806 | All SZGR 2.0 genes in this pathway |
| SCHEIDEREIT IKK INTERACTING PROTEINS | 58 | 45 | All SZGR 2.0 genes in this pathway |
| MOHANKUMAR TLX1 TARGETS UP | 414 | 287 | All SZGR 2.0 genes in this pathway |
| SHEPARD CRUSH AND BURN MUTANT UP | 197 | 110 | All SZGR 2.0 genes in this pathway |
| SHEPARD BMYB MORPHOLINO UP | 205 | 126 | All SZGR 2.0 genes in this pathway |
| HESS TARGETS OF HOXA9 AND MEIS1 UP | 65 | 44 | All SZGR 2.0 genes in this pathway |
| GRADE COLON AND RECTAL CANCER UP | 285 | 167 | All SZGR 2.0 genes in this pathway |
| BLUM RESPONSE TO SALIRASIB UP | 245 | 159 | All SZGR 2.0 genes in this pathway |
| MOOTHA PGC | 420 | 269 | All SZGR 2.0 genes in this pathway |
| LEE BMP2 TARGETS DN | 882 | 538 | All SZGR 2.0 genes in this pathway |
Section VI. microRNA annotation
| miRNA family | Target position | miRNA ID | miRNA seq | ||
|---|---|---|---|---|---|
| UTR start | UTR end | Match method | |||
| miR-145 | 25 | 31 | 1A | hsa-miR-145 | GUCCAGUUUUCCCAGGAAUCCCUU |
| miR-148/152 | 102 | 108 | 1A | hsa-miR-148a | UCAGUGCACUACAGAACUUUGU |
| hsa-miR-152brain | UCAGUGCAUGACAGAACUUGGG | ||||
| hsa-miR-148b | UCAGUGCAUCACAGAACUUUGU | ||||
| miR-181 | 1176 | 1182 | 1A | hsa-miR-181abrain | AACAUUCAACGCUGUCGGUGAGU |
| hsa-miR-181bSZ | AACAUUCAUUGCUGUCGGUGGG | ||||
| hsa-miR-181cbrain | AACAUUCAACCUGUCGGUGAGU | ||||
| hsa-miR-181dbrain | AACAUUCAUUGUUGUCGGUGGGUU | ||||
| miR-485-5p | 1024 | 1030 | m8 | hsa-miR-485-5p | AGAGGCUGGCCGUGAUGAAUUC |
| miR-496 | 1178 | 1184 | 1A | hsa-miR-496 | AUUACAUGGCCAAUCUC |
| hsa-miR-496 | AUUACAUGGCCAAUCUC | ||||
- SZ: miRNAs which differentially expressed in brain cortex of schizophrenia patients comparing with control samples using microarray. Click here to see the list of SZ related miRNAs.
- Brain: miRNAs which are expressed in brain based on miRNA microarray expression studies. Click here to see the list of brain related miRNAs.