Gene Page: MTFR1
Summary ?
| GeneID | 9650 |
| Symbol | MTFR1 |
| Synonyms | CHPPR|FAM54A2 |
| Description | mitochondrial fission regulator 1 |
| Reference | HGNC:HGNC:29510|Ensembl:ENSG00000066855|HPRD:12389|Vega:OTTHUMG00000164468 |
| Gene type | protein-coding |
| Map location | 8q13.1 |
| Pascal p-value | 0.182 |
| Sherlock p-value | 0.977 |
| Fetal beta | 0.961 |
| DMG | 1 (# studies) |
| eGene | Nucleus accumbens basal ganglia Myers' cis & trans |
Gene in Data Sources
| Gene set name | Method of gene set | Description | Info |
|---|---|---|---|
| CV:PGCnp | Genome-wide Association Study | GWAS | |
| DMG:Jaffe_2016 | Genome-wide DNA methylation analysis | This dataset includes 2,104 probes/CpGs associated with SZ patients (n=108) compared to 136 controls at Bonferroni-adjusted P < 0.05. | 1 |
Section I. Genetics and epigenetics annotation
 Differentially methylated gene
| Probe | Chromosome | Position | Nearest gene | P (dis) | Beta (dis) | FDR (dis) | Study |
|---|---|---|---|---|---|---|---|
| cg14299177 | 8 | 66557547 | MTFR1 | 1.57E-8 | -0.021 | 5.87E-6 | DMG:Jaffe_2016 |
eQTL annotation
| SNP ID | Chromosome | Position | eGene | Gene Entrez ID | pvalue | qvalue | TSS distance | eQTL type |
|---|---|---|---|---|---|---|---|---|
| rs12123144 | chr1 | 76550208 | MTFR1 | 9650 | 0.17 | trans |
Section II. Transcriptome annotation
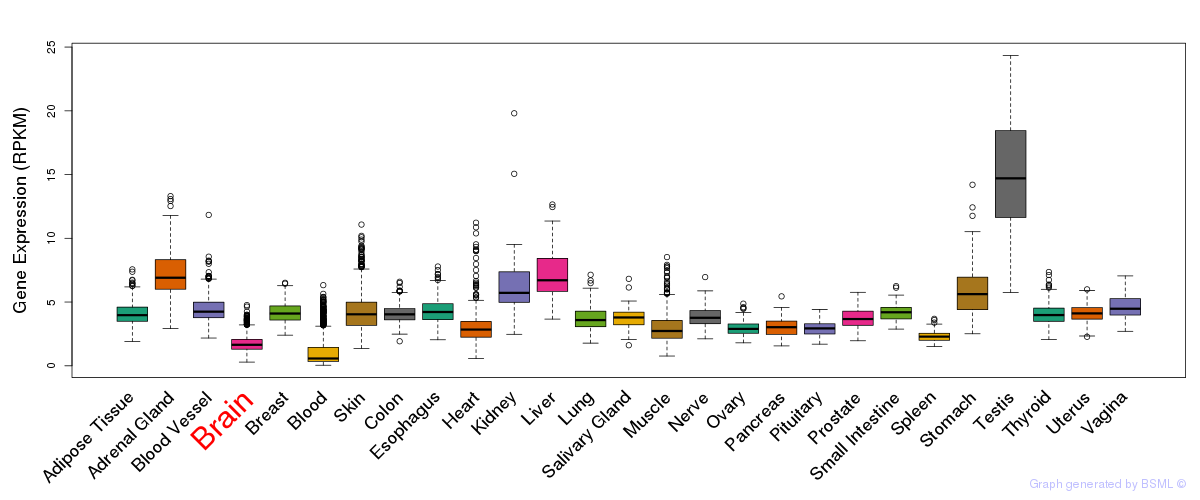
General gene expression (GTEx)
Gene expression during devlopment (BrainCloud)
Footnote:
A total of 269 time points ploted, with n=38 fetal samples (x=1:38). Each triangle represents one time point.
Gene expression of temporal and spatial changes (BrainSpan)
Footnote:
SC: sub-cortical regions; SM: sensory-motor regions; FC: frontal cortex; and TP: temporal-parietal cortex
ST1: fetal (13 - 26 postconception weeks), ST2: early infancy to late childhood (4 months to 11 years), and ST3: adolescence to adulthood (13 - 23 years)
The bar shown representes the lower 25% and upper 25% of the expression distribution.
Top co-expressed genes in brain regions
| Top 10 positively co-expressed genes | ||
| Gene | Pearson's Correlation | Spearman's Correlation |
| ABL1 | 0.96 | 0.96 |
| PLCG1 | 0.96 | 0.95 |
| ZNF532 | 0.95 | 0.95 |
| UNK | 0.95 | 0.96 |
| KIAA0892 | 0.95 | 0.96 |
| PLAGL2 | 0.95 | 0.92 |
| DOT1L | 0.94 | 0.92 |
| TRRAP | 0.94 | 0.95 |
| GCN1L1 | 0.94 | 0.93 |
| SPEN | 0.94 | 0.95 |
| Top 10 negatively co-expressed genes | ||
| Gene | Pearson's Correlation | Spearman's Correlation |
| C5orf53 | -0.66 | -0.74 |
| AF347015.31 | -0.65 | -0.84 |
| AF347015.27 | -0.64 | -0.82 |
| MT-CO2 | -0.63 | -0.83 |
| S100B | -0.62 | -0.77 |
| IFI27 | -0.62 | -0.77 |
| ACOT13 | -0.61 | -0.68 |
| AF347015.33 | -0.61 | -0.76 |
| MT-CYB | -0.61 | -0.79 |
| FXYD1 | -0.60 | -0.77 |
Section V. Pathway annotation
| Pathway name | Pathway size | # SZGR 2.0 genes in pathway | Info |
|---|---|---|---|
| ONKEN UVEAL MELANOMA UP | 783 | 507 | All SZGR 2.0 genes in this pathway |
| DEURIG T CELL PROLYMPHOCYTIC LEUKEMIA UP | 368 | 234 | All SZGR 2.0 genes in this pathway |
| TIEN INTESTINE PROBIOTICS 24HR DN | 214 | 133 | All SZGR 2.0 genes in this pathway |
| KINSEY TARGETS OF EWSR1 FLII FUSION UP | 1278 | 748 | All SZGR 2.0 genes in this pathway |
| RODRIGUES THYROID CARCINOMA POORLY DIFFERENTIATED UP | 633 | 376 | All SZGR 2.0 genes in this pathway |
| FARMER BREAST CANCER APOCRINE VS LUMINAL | 326 | 213 | All SZGR 2.0 genes in this pathway |
| FARMER BREAST CANCER CLUSTER 2 | 33 | 17 | All SZGR 2.0 genes in this pathway |
| DACOSTA UV RESPONSE VIA ERCC3 DN | 855 | 609 | All SZGR 2.0 genes in this pathway |
| WEI MYCN TARGETS WITH E BOX | 795 | 478 | All SZGR 2.0 genes in this pathway |
| SMITH LIVER CANCER | 45 | 27 | All SZGR 2.0 genes in this pathway |
| IVANOVA HEMATOPOIESIS LATE PROGENITOR | 544 | 307 | All SZGR 2.0 genes in this pathway |
| ZHENG FOXP3 TARGETS IN THYMUS UP | 196 | 137 | All SZGR 2.0 genes in this pathway |
| ACEVEDO LIVER CANCER UP | 973 | 570 | All SZGR 2.0 genes in this pathway |
| ACEVEDO LIVER TUMOR VS NORMAL ADJACENT TISSUE UP | 863 | 514 | All SZGR 2.0 genes in this pathway |
| PILON KLF1 TARGETS DN | 1972 | 1213 | All SZGR 2.0 genes in this pathway |
| LEE BMP2 TARGETS DN | 882 | 538 | All SZGR 2.0 genes in this pathway |
| RATTENBACHER BOUND BY CELF1 | 467 | 251 | All SZGR 2.0 genes in this pathway |