Gene Page: MPHOSPH10
Summary ?
| GeneID | 10199 |
| Symbol | MPHOSPH10 |
| Synonyms | CT90|MPP10|MPP10P|PPP1R106 |
| Description | M-phase phosphoprotein 10 |
| Reference | MIM:605503|HGNC:HGNC:7213|Ensembl:ENSG00000124383|HPRD:10404|Vega:OTTHUMG00000129715 |
| Gene type | protein-coding |
| Map location | 2p13.3 |
| Pascal p-value | 0.039 |
| Sherlock p-value | 0.976 |
| Fetal beta | 0.619 |
| DMG | 1 (# studies) |
| eGene | Myers' cis & trans Meta |
Gene in Data Sources
| Gene set name | Method of gene set | Description | Info |
|---|---|---|---|
| CV:PGCnp | Genome-wide Association Study | GWAS | |
| DMG:Jaffe_2016 | Genome-wide DNA methylation analysis | This dataset includes 2,104 probes/CpGs associated with SZ patients (n=108) compared to 136 controls at Bonferroni-adjusted P < 0.05. | 1 |
Section I. Genetics and epigenetics annotation
 Differentially methylated gene
| Probe | Chromosome | Position | Nearest gene | P (dis) | Beta (dis) | FDR (dis) | Study |
|---|---|---|---|---|---|---|---|
| cg20921688 | 2 | 71357800 | MPHOSPH10 | 7.65E-8 | -0.006 | 1.81E-5 | DMG:Jaffe_2016 |
eQTL annotation
| SNP ID | Chromosome | Position | eGene | Gene Entrez ID | pvalue | qvalue | TSS distance | eQTL type |
|---|---|---|---|---|---|---|---|---|
| rs1807299 | chr3 | 134470799 | MPHOSPH10 | 10199 | 0.12 | trans | ||
| rs7778042 | chr7 | 29637891 | MPHOSPH10 | 10199 | 0.19 | trans | ||
| rs3779536 | chr7 | 127233976 | MPHOSPH10 | 10199 | 0.06 | trans |
Section II. Transcriptome annotation
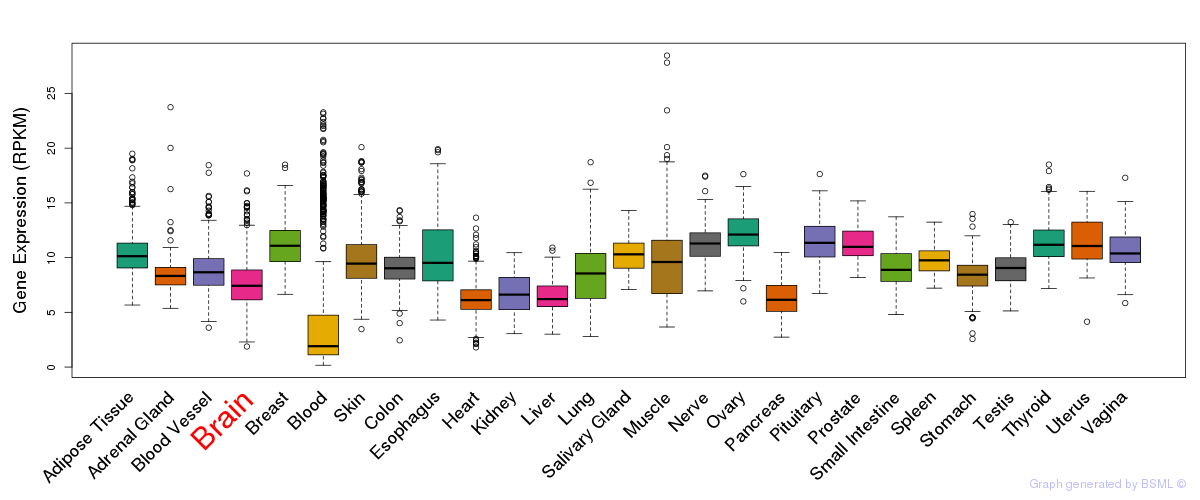
General gene expression (GTEx)
Gene expression during devlopment (BrainCloud)
Footnote:
A total of 269 time points ploted, with n=38 fetal samples (x=1:38). Each triangle represents one time point.
Gene expression of temporal and spatial changes (BrainSpan)
Footnote:
SC: sub-cortical regions; SM: sensory-motor regions; FC: frontal cortex; and TP: temporal-parietal cortex
ST1: fetal (13 - 26 postconception weeks), ST2: early infancy to late childhood (4 months to 11 years), and ST3: adolescence to adulthood (13 - 23 years)
The bar shown representes the lower 25% and upper 25% of the expression distribution.
Top co-expressed genes in brain regions
| Top 10 positively co-expressed genes | ||
| Gene | Pearson's Correlation | Spearman's Correlation |
| SAMD9L | 0.60 | 0.74 |
| C1S | 0.55 | 0.68 |
| TRIM6-TRIM34 | 0.54 | 0.60 |
| AC068989.2 | 0.54 | 0.64 |
| XXbac-BPG116M5.1 | 0.53 | 0.64 |
| PTPRC | 0.53 | 0.56 |
| RSAD2 | 0.52 | 0.68 |
| TLR3 | 0.52 | 0.56 |
| C1QA | 0.51 | 0.55 |
| PARP9 | 0.51 | 0.66 |
| Top 10 negatively co-expressed genes | ||
| Gene | Pearson's Correlation | Spearman's Correlation |
| SOX11 | -0.43 | -0.42 |
| HMGA1 | -0.41 | -0.49 |
| H2AFY2 | -0.40 | -0.42 |
| IGLON5 | -0.40 | -0.44 |
| XKR7 | -0.40 | -0.45 |
| HNRNPA0 | -0.40 | -0.44 |
| ACTG1 | -0.40 | -0.45 |
| LRRC3 | -0.39 | -0.44 |
| TAX1BP3 | -0.39 | -0.45 |
| VARS | -0.39 | -0.49 |
Section V. Pathway annotation
| Pathway name | Pathway size | # SZGR 2.0 genes in pathway | Info |
|---|---|---|---|
| RODRIGUES THYROID CARCINOMA POORLY DIFFERENTIATED UP | 633 | 376 | All SZGR 2.0 genes in this pathway |
| RODRIGUES THYROID CARCINOMA ANAPLASTIC UP | 722 | 443 | All SZGR 2.0 genes in this pathway |
| GRAESSMANN APOPTOSIS BY DOXORUBICIN DN | 1781 | 1082 | All SZGR 2.0 genes in this pathway |
| GRAESSMANN RESPONSE TO MC AND DOXORUBICIN DN | 770 | 415 | All SZGR 2.0 genes in this pathway |
| HAMAI APOPTOSIS VIA TRAIL UP | 584 | 356 | All SZGR 2.0 genes in this pathway |
| PUJANA BRCA1 PCC NETWORK | 1652 | 1023 | All SZGR 2.0 genes in this pathway |
| PUJANA CHEK2 PCC NETWORK | 779 | 480 | All SZGR 2.0 genes in this pathway |
| WEI MYCN TARGETS WITH E BOX | 795 | 478 | All SZGR 2.0 genes in this pathway |
| GARCIA TARGETS OF FLI1 AND DAX1 DN | 176 | 104 | All SZGR 2.0 genes in this pathway |
| RICKMAN METASTASIS UP | 344 | 180 | All SZGR 2.0 genes in this pathway |
| PENG GLUTAMINE DEPRIVATION DN | 337 | 230 | All SZGR 2.0 genes in this pathway |
| RAMALHO STEMNESS UP | 206 | 118 | All SZGR 2.0 genes in this pathway |
| DAZARD RESPONSE TO UV SCC DN | 123 | 86 | All SZGR 2.0 genes in this pathway |
| WESTON VEGFA TARGETS | 108 | 71 | All SZGR 2.0 genes in this pathway |
| DAZARD RESPONSE TO UV NHEK DN | 318 | 220 | All SZGR 2.0 genes in this pathway |
| WESTON VEGFA TARGETS 3HR | 74 | 47 | All SZGR 2.0 genes in this pathway |
| BRUINS UVC RESPONSE VIA TP53 GROUP A | 898 | 516 | All SZGR 2.0 genes in this pathway |
| LEE BMP2 TARGETS DN | 882 | 538 | All SZGR 2.0 genes in this pathway |
| PHONG TNF RESPONSE NOT VIA P38 | 337 | 236 | All SZGR 2.0 genes in this pathway |