Gene Page: FAM189B
Summary ?
| GeneID | 10712 |
| Symbol | FAM189B |
| Synonyms | C1orf2|COTE1 |
| Description | family with sequence similarity 189 member B |
| Reference | HGNC:HGNC:1233|Ensembl:ENSG00000160767|HPRD:08511|Vega:OTTHUMG00000035844 |
| Gene type | protein-coding |
| Map location | 1q21 |
| Sherlock p-value | 0.463 |
| Fetal beta | 0.299 |
| DMG | 1 (# studies) |
| eGene | Cerebellar Hemisphere Cerebellum |
Gene in Data Sources
| Gene set name | Method of gene set | Description | Info |
|---|---|---|---|
| CV:PGCnp | Genome-wide Association Study | GWAS | |
| DMG:Wockner_2014 | Genome-wide DNA methylation analysis | This dataset includes 4641 differentially methylated probes corresponding to 2929 unique genes between schizophrenia patients (n=24) and controls (n=24). | 1 |
Section I. Genetics and epigenetics annotation
 Differentially methylated gene
| Probe | Chromosome | Position | Nearest gene | P (dis) | Beta (dis) | FDR (dis) | Study |
|---|---|---|---|---|---|---|---|
| cg21908287 | 1 | 155225385 | FAM189B | 3.736E-4 | -0.451 | 0.043 | DMG:Wockner_2014 |
Section II. Transcriptome annotation
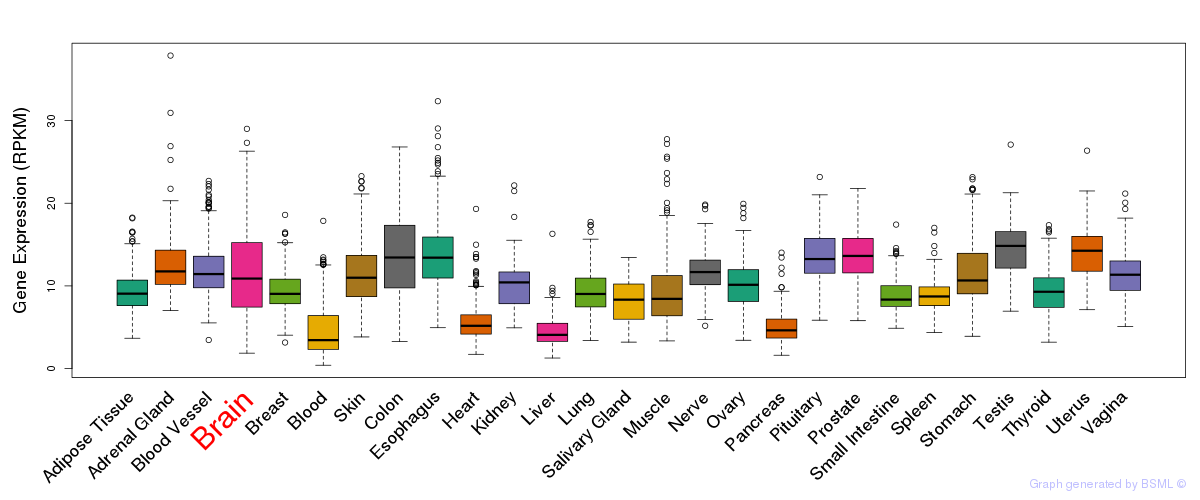
General gene expression (GTEx)
Gene expression during devlopment (BrainCloud)
Footnote:
A total of 269 time points ploted, with n=38 fetal samples (x=1:38). Each triangle represents one time point.
Gene expression of temporal and spatial changes (BrainSpan)
Footnote:
SC: sub-cortical regions; SM: sensory-motor regions; FC: frontal cortex; and TP: temporal-parietal cortex
ST1: fetal (13 - 26 postconception weeks), ST2: early infancy to late childhood (4 months to 11 years), and ST3: adolescence to adulthood (13 - 23 years)
The bar shown representes the lower 25% and upper 25% of the expression distribution.
Top co-expressed genes in brain regions
| Top 10 positively co-expressed genes | ||
| Gene | Pearson's Correlation | Spearman's Correlation |
| NDUFA7 | 0.78 | 0.59 |
| SELM | 0.76 | 0.63 |
| POLD4 | 0.76 | 0.58 |
| CHCHD10 | 0.76 | 0.61 |
| KB-1839H6.1 | 0.76 | 0.61 |
| PSMB10 | 0.76 | 0.60 |
| C2orf7 | 0.75 | 0.56 |
| GSTK1 | 0.75 | 0.62 |
| TMEM141 | 0.75 | 0.61 |
| C11orf59 | 0.74 | 0.53 |
| Top 10 negatively co-expressed genes | ||
| Gene | Pearson's Correlation | Spearman's Correlation |
| ZC3H13 | -0.48 | -0.50 |
| ZNF326 | -0.47 | -0.55 |
| THOC2 | -0.46 | -0.56 |
| EIF3A | -0.46 | -0.51 |
| NCL | -0.46 | -0.52 |
| UPF2 | -0.45 | -0.48 |
| CDC2L2 | -0.45 | -0.46 |
| GIGYF2 | -0.45 | -0.46 |
| MAP4K4 | -0.45 | -0.51 |
| RTF1 | -0.45 | -0.50 |
Section III. Gene Ontology annotation
| Molecular function | GO term | Evidence | Neuro keywords | PubMed ID |
|---|---|---|---|---|
| GO:0003674 | molecular_function | ND | - | |
| GO:0050699 | WW domain binding | IPI | 15064722 | |
| Biological process | GO term | Evidence | Neuro keywords | PubMed ID |
| GO:0008150 | biological_process | ND | - | |
| Cellular component | GO term | Evidence | Neuro keywords | PubMed ID |
| GO:0016020 | membrane | IEA | - | |
| GO:0016021 | integral to membrane | NAS | - |
Section V. Pathway annotation
| Pathway name | Pathway size | # SZGR 2.0 genes in pathway | Info |
|---|---|---|---|
| DODD NASOPHARYNGEAL CARCINOMA DN | 1375 | 806 | All SZGR 2.0 genes in this pathway |
| ENK UV RESPONSE EPIDERMIS UP | 293 | 179 | All SZGR 2.0 genes in this pathway |
| GRAESSMANN APOPTOSIS BY DOXORUBICIN UP | 1142 | 669 | All SZGR 2.0 genes in this pathway |
| GAUSSMANN MLL AF4 FUSION TARGETS F UP | 185 | 119 | All SZGR 2.0 genes in this pathway |
| PATIL LIVER CANCER | 747 | 453 | All SZGR 2.0 genes in this pathway |
| LOPEZ MBD TARGETS | 957 | 597 | All SZGR 2.0 genes in this pathway |
| BENPORATH CYCLING GENES | 648 | 385 | All SZGR 2.0 genes in this pathway |
| NIKOLSKY BREAST CANCER 1Q21 AMPLICON | 38 | 18 | All SZGR 2.0 genes in this pathway |
| NIKOLSKY MUTATED AND AMPLIFIED IN BREAST CANCER | 94 | 60 | All SZGR 2.0 genes in this pathway |
| IVANOVA HEMATOPOIESIS STEM CELL AND PROGENITOR | 681 | 420 | All SZGR 2.0 genes in this pathway |
| MARSON BOUND BY E2F4 UNSTIMULATED | 728 | 415 | All SZGR 2.0 genes in this pathway |
| HOFFMANN PRE BI TO LARGE PRE BII LYMPHOCYTE DN | 75 | 61 | All SZGR 2.0 genes in this pathway |
| MIKKELSEN ES ICP WITH H3K4ME3 | 718 | 401 | All SZGR 2.0 genes in this pathway |
| MIKKELSEN NPC ICP WITH H3K4ME3 | 445 | 257 | All SZGR 2.0 genes in this pathway |
| DASU IL6 SIGNALING UP | 59 | 44 | All SZGR 2.0 genes in this pathway |
| WHITFIELD CELL CYCLE M G1 | 148 | 95 | All SZGR 2.0 genes in this pathway |
| LINSLEY MIR16 TARGETS | 206 | 127 | All SZGR 2.0 genes in this pathway |
| KUMAR PATHOGEN LOAD BY MACROPHAGES | 275 | 155 | All SZGR 2.0 genes in this pathway |
| KUMAR AUTOPHAGY NETWORK | 71 | 46 | All SZGR 2.0 genes in this pathway |
Section VI. microRNA annotation
| miRNA family | Target position | miRNA ID | miRNA seq | ||
|---|---|---|---|---|---|
| UTR start | UTR end | Match method | |||
| miR-103/107 | 199 | 205 | 1A | hsa-miR-103brain | AGCAGCAUUGUACAGGGCUAUGA |
| hsa-miR-107brain | AGCAGCAUUGUACAGGGCUAUCA | ||||
| miR-543 | 506 | 512 | m8 | hsa-miR-543 | AAACAUUCGCGGUGCACUUCU |
- SZ: miRNAs which differentially expressed in brain cortex of schizophrenia patients comparing with control samples using microarray. Click here to see the list of SZ related miRNAs.
- Brain: miRNAs which are expressed in brain based on miRNA microarray expression studies. Click here to see the list of brain related miRNAs.