Gene Page: RPRD2
Summary ?
| GeneID | 23248 |
| Symbol | RPRD2 |
| Synonyms | HSPC099|KIAA0460 |
| Description | regulation of nuclear pre-mRNA domain containing 2 |
| Reference | MIM:614695|HGNC:HGNC:29039|Ensembl:ENSG00000163125|Vega:OTTHUMG00000012808 |
| Gene type | protein-coding |
| Map location | 1q21.3 |
| Sherlock p-value | 0.515 |
| Fetal beta | 1.16 |
| DMG | 1 (# studies) |
| eGene | Myers' cis & trans |
| Support | CompositeSet Darnell FMRP targets |
Gene in Data Sources
| Gene set name | Method of gene set | Description | Info |
|---|---|---|---|
| CV:PGCnp | Genome-wide Association Study | GWAS | |
| DMG:Jaffe_2016 | Genome-wide DNA methylation analysis | This dataset includes 2,104 probes/CpGs associated with SZ patients (n=108) compared to 136 controls at Bonferroni-adjusted P < 0.05. | 1 |
Section I. Genetics and epigenetics annotation
 Differentially methylated gene
| Probe | Chromosome | Position | Nearest gene | P (dis) | Beta (dis) | FDR (dis) | Study |
|---|---|---|---|---|---|---|---|
| cg07066868 | 1 | 150337482 | RPRD2 | 5.27E-8 | -0.016 | 1.38E-5 | DMG:Jaffe_2016 |
eQTL annotation
| SNP ID | Chromosome | Position | eGene | Gene Entrez ID | pvalue | qvalue | TSS distance | eQTL type |
|---|---|---|---|---|---|---|---|---|
| rs16829545 | chr2 | 151977407 | RPRD2 | 23248 | 0.13 | trans | ||
| rs16955618 | chr15 | 29937543 | RPRD2 | 23248 | 0.06 | trans |
Section II. Transcriptome annotation
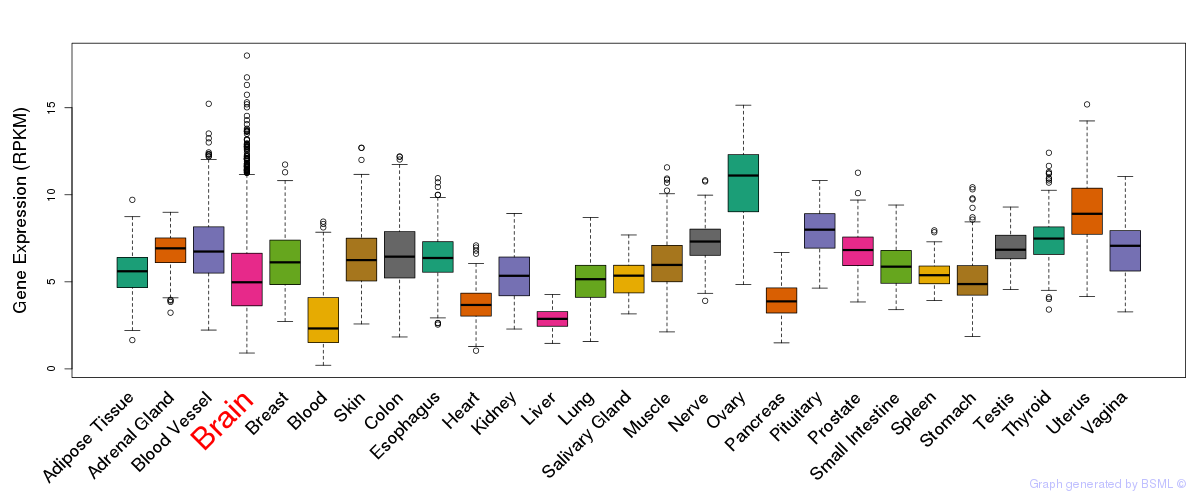
General gene expression (GTEx)
Gene expression during devlopment (BrainCloud)
Footnote:
A total of 269 time points ploted, with n=38 fetal samples (x=1:38). Each triangle represents one time point.
Gene expression of temporal and spatial changes (BrainSpan)
Footnote:
SC: sub-cortical regions; SM: sensory-motor regions; FC: frontal cortex; and TP: temporal-parietal cortex
ST1: fetal (13 - 26 postconception weeks), ST2: early infancy to late childhood (4 months to 11 years), and ST3: adolescence to adulthood (13 - 23 years)
The bar shown representes the lower 25% and upper 25% of the expression distribution.
Top co-expressed genes in brain regions
| Top 10 positively co-expressed genes | ||
| Gene | Pearson's Correlation | Spearman's Correlation |
| ITPKB | 0.81 | 0.83 |
| LRP10 | 0.79 | 0.83 |
| HEPACAM | 0.79 | 0.77 |
| NFATC1 | 0.78 | 0.77 |
| TIMP3 | 0.78 | 0.78 |
| ZCCHC24 | 0.78 | 0.79 |
| CSF1 | 0.76 | 0.81 |
| PRELP | 0.76 | 0.80 |
| PBXIP1 | 0.76 | 0.77 |
| CHDH | 0.75 | 0.78 |
| Top 10 negatively co-expressed genes | ||
| Gene | Pearson's Correlation | Spearman's Correlation |
| POLB | -0.50 | -0.59 |
| FRG1 | -0.50 | -0.59 |
| STMN1 | -0.49 | -0.55 |
| MED19 | -0.49 | -0.55 |
| NR2C2AP | -0.48 | -0.55 |
| PPP3CC | -0.48 | -0.51 |
| GNL3 | -0.47 | -0.52 |
| COQ3 | -0.47 | -0.53 |
| C18orf21 | -0.46 | -0.53 |
| C11orf57 | -0.46 | -0.58 |
Section III. Gene Ontology annotation
| Molecular function | GO term | Evidence | Neuro keywords | PubMed ID |
|---|---|---|---|---|
| GO:0005515 | protein binding | IPI | 15231747 |
Section V. Pathway annotation
| Pathway name | Pathway size | # SZGR 2.0 genes in pathway | Info |
|---|---|---|---|
| HORIUCHI WTAP TARGETS DN | 310 | 188 | All SZGR 2.0 genes in this pathway |
| GAUSSMANN MLL AF4 FUSION TARGETS C UP | 170 | 114 | All SZGR 2.0 genes in this pathway |
| SCHLOSSER SERUM RESPONSE UP | 134 | 93 | All SZGR 2.0 genes in this pathway |
| PATIL LIVER CANCER | 747 | 453 | All SZGR 2.0 genes in this pathway |
| MOHANKUMAR TLX1 TARGETS UP | 414 | 287 | All SZGR 2.0 genes in this pathway |
| SCHAEFFER PROSTATE DEVELOPMENT 6HR UP | 176 | 115 | All SZGR 2.0 genes in this pathway |
| MARIADASON RESPONSE TO BUTYRATE SULINDAC 6 | 52 | 32 | All SZGR 2.0 genes in this pathway |
| IWANAGA CARCINOGENESIS BY KRAS PTEN UP | 181 | 112 | All SZGR 2.0 genes in this pathway |
| ZHANG BREAST CANCER PROGENITORS UP | 425 | 253 | All SZGR 2.0 genes in this pathway |
| KIM ALL DISORDERS OLIGODENDROCYTE NUMBER CORR UP | 756 | 494 | All SZGR 2.0 genes in this pathway |
| WANG RESPONSE TO GSK3 INHIBITOR SB216763 UP | 397 | 206 | All SZGR 2.0 genes in this pathway |
| FIGUEROA AML METHYLATION CLUSTER 2 UP | 54 | 31 | All SZGR 2.0 genes in this pathway |
| FIGUEROA AML METHYLATION CLUSTER 7 UP | 118 | 68 | All SZGR 2.0 genes in this pathway |
| PILON KLF1 TARGETS DN | 1972 | 1213 | All SZGR 2.0 genes in this pathway |
| PHONG TNF RESPONSE VIA P38 COMPLETE | 227 | 151 | All SZGR 2.0 genes in this pathway |