Gene Page: REG1A
Summary ?
| GeneID | 5967 |
| Symbol | REG1A |
| Synonyms | ICRF|P19|PSP|PSPS|PSPS1|PTP|REG |
| Description | regenerating family member 1 alpha |
| Reference | MIM:167770|HGNC:HGNC:9951|Ensembl:ENSG00000115386|HPRD:01338|Vega:OTTHUMG00000130016 |
| Gene type | protein-coding |
| Map location | 2p12 |
| Pascal p-value | 0.035 |
| Fetal beta | 0.159 |
| eGene | Myers' cis & trans |
Gene in Data Sources
| Gene set name | Method of gene set | Description | Info |
|---|---|---|---|
| CV:GWASdb | Genome-wide Association Studies | GWASdb records for schizophrenia | |
| CV:PGCnp | Genome-wide Association Study | GWAS |
Section I. Genetics and epigenetics annotation
 eQTL annotation
| SNP ID | Chromosome | Position | eGene | Gene Entrez ID | pvalue | qvalue | TSS distance | eQTL type |
|---|---|---|---|---|---|---|---|---|
| rs1578978 | chr8 | 118196802 | REG1A | 5967 | 0.13 | trans |
Section II. Transcriptome annotation
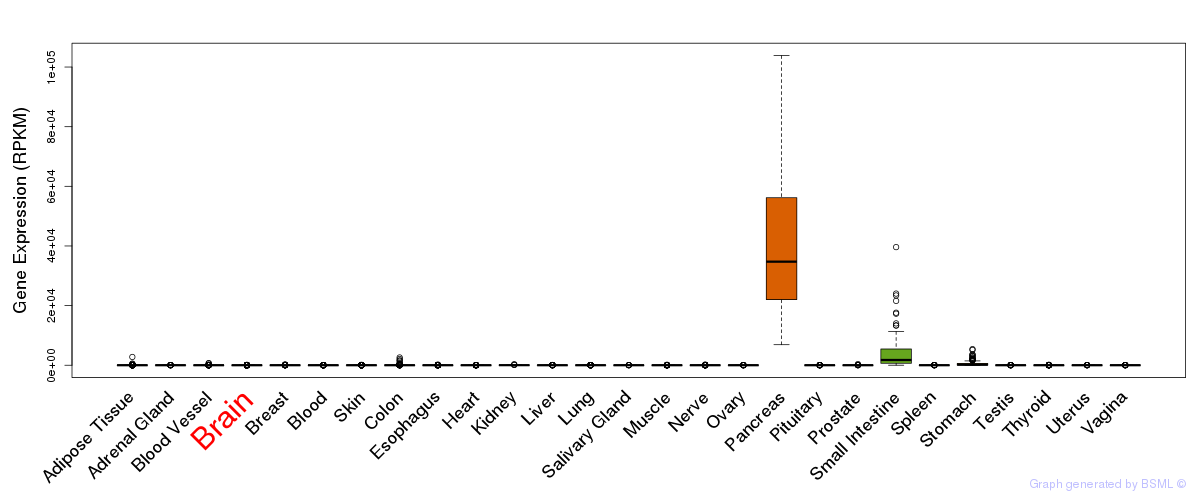
General gene expression (GTEx)
Gene expression during devlopment (BrainCloud)
Footnote:
A total of 269 time points ploted, with n=38 fetal samples (x=1:38). Each triangle represents one time point.
Gene expression of temporal and spatial changes (BrainSpan)
Footnote:
SC: sub-cortical regions; SM: sensory-motor regions; FC: frontal cortex; and TP: temporal-parietal cortex
ST1: fetal (13 - 26 postconception weeks), ST2: early infancy to late childhood (4 months to 11 years), and ST3: adolescence to adulthood (13 - 23 years)
The bar shown representes the lower 25% and upper 25% of the expression distribution.
Top co-expressed genes in brain regions
| Top 10 positively co-expressed genes | ||
| Gene | Pearson's Correlation | Spearman's Correlation |
| GCNT4 | 0.92 | 0.86 |
| CHN1 | 0.92 | 0.94 |
| HTR2A | 0.91 | 0.75 |
| HLF | 0.91 | 0.88 |
| OXR1 | 0.91 | 0.75 |
| TMEM155 | 0.91 | 0.82 |
| MKX | 0.90 | 0.71 |
| DIRAS2 | 0.90 | 0.68 |
| ELL2 | 0.89 | 0.67 |
| NDFIP2 | 0.89 | 0.68 |
| Top 10 negatively co-expressed genes | ||
| Gene | Pearson's Correlation | Spearman's Correlation |
| FADS2 | -0.59 | -0.66 |
| SEMA4B | -0.55 | -0.68 |
| BCL7C | -0.55 | -0.72 |
| GPR125 | -0.53 | -0.55 |
| SH3BP2 | -0.51 | -0.77 |
| TRAF4 | -0.51 | -0.77 |
| PDE9A | -0.51 | -0.75 |
| FAM59B | -0.51 | -0.52 |
| CNTFR | -0.50 | -0.63 |
| CDC42EP4 | -0.50 | -0.52 |
Section V. Pathway annotation
| Pathway name | Pathway size | # SZGR 2.0 genes in pathway | Info |
|---|---|---|---|
| ST INTERFERON GAMMA PATHWAY | 10 | 7 | All SZGR 2.0 genes in this pathway |
| ST JAK STAT PATHWAY | 9 | 8 | All SZGR 2.0 genes in this pathway |
| ST STAT3 PATHWAY | 11 | 10 | All SZGR 2.0 genes in this pathway |
| ST TYPE I INTERFERON PATHWAY | 9 | 8 | All SZGR 2.0 genes in this pathway |
| VECCHI GASTRIC CANCER ADVANCED VS EARLY DN | 138 | 70 | All SZGR 2.0 genes in this pathway |
| VECCHI GASTRIC CANCER EARLY DN | 367 | 220 | All SZGR 2.0 genes in this pathway |
| SABATES COLORECTAL ADENOMA UP | 141 | 75 | All SZGR 2.0 genes in this pathway |
| WANG BARRETTS ESOPHAGUS UP | 51 | 27 | All SZGR 2.0 genes in this pathway |
| CAVARD LIVER CANCER MALIGNANT VS BENIGN | 32 | 19 | All SZGR 2.0 genes in this pathway |
| PATIL LIVER CANCER | 747 | 453 | All SZGR 2.0 genes in this pathway |
| LEE LIVER CANCER CIPROFIBRATE DN | 66 | 43 | All SZGR 2.0 genes in this pathway |
| TARTE PLASMA CELL VS PLASMABLAST UP | 398 | 262 | All SZGR 2.0 genes in this pathway |
| LEE LIVER CANCER MYC E2F1 DN | 64 | 38 | All SZGR 2.0 genes in this pathway |
| POMEROY MEDULLOBLASTOMA PROGNOSIS UP | 47 | 30 | All SZGR 2.0 genes in this pathway |
| LEE LIVER CANCER DENA DN | 74 | 45 | All SZGR 2.0 genes in this pathway |
| LEE LIVER CANCER MYC DN | 63 | 40 | All SZGR 2.0 genes in this pathway |
| LEE LIVER CANCER E2F1 DN | 64 | 42 | All SZGR 2.0 genes in this pathway |
| SANSOM APC TARGETS DN | 366 | 238 | All SZGR 2.0 genes in this pathway |
| YANG MUC2 TARGETS DUODENUM 6MO DN | 21 | 12 | All SZGR 2.0 genes in this pathway |
| SMID BREAST CANCER BASAL UP | 648 | 398 | All SZGR 2.0 genes in this pathway |
| YAUCH HEDGEHOG SIGNALING PARACRINE UP | 149 | 85 | All SZGR 2.0 genes in this pathway |
| YOSHIMURA MAPK8 TARGETS UP | 1305 | 895 | All SZGR 2.0 genes in this pathway |
| BOYAULT LIVER CANCER SUBCLASS G6 UP | 65 | 43 | All SZGR 2.0 genes in this pathway |
| CHIANG LIVER CANCER SUBCLASS CTNNB1 UP | 176 | 110 | All SZGR 2.0 genes in this pathway |
| FEVR CTNNB1 TARGETS DN | 553 | 343 | All SZGR 2.0 genes in this pathway |
| FOSTER KDM1A TARGETS UP | 266 | 142 | All SZGR 2.0 genes in this pathway |
| NABA ECM AFFILIATED | 171 | 89 | All SZGR 2.0 genes in this pathway |
| NABA MATRISOME ASSOCIATED | 753 | 411 | All SZGR 2.0 genes in this pathway |
| NABA MATRISOME | 1028 | 559 | All SZGR 2.0 genes in this pathway |