Gene Page: TAT
Summary ?
| GeneID | 6898 |
| Symbol | TAT |
| Synonyms | - |
| Description | tyrosine aminotransferase |
| Reference | MIM:613018|HGNC:HGNC:11573|HPRD:11776| |
| Gene type | protein-coding |
| Map location | 16q22.1 |
| Pascal p-value | 0.055 |
| DEG p-value | DEG:Zhao_2015:p=4.68e-04:q=0.0926 |
Gene in Data Sources
| Gene set name | Method of gene set | Description | Info |
|---|---|---|---|
| CV:PGCnp | Genome-wide Association Study | GWAS | |
| DEG:Zhao_2015 | RNA Sequencing analysis | Transcriptome sequencing and genome-wide association analyses reveal lysosomal function and actin cytoskeleton remodeling in schizophrenia and bipolar disorder. | |
| PMID:cooccur | High-throughput literature-search | Systematic search in PubMed for genes co-occurring with SCZ keywords. A total of 3027 genes were included. | |
| Literature | High-throughput literature-search | Co-occurance with Schizophrenia keywords: schizophrenia,schizophrenic,schizophrenics,schizophrenias,schizotypal | Click to show details |
| GO_Annotation | Mapping neuro-related keywords to Gene Ontology annotations | Hits with neuro-related keywords: 2 |
Section I. Genetics and epigenetics annotation
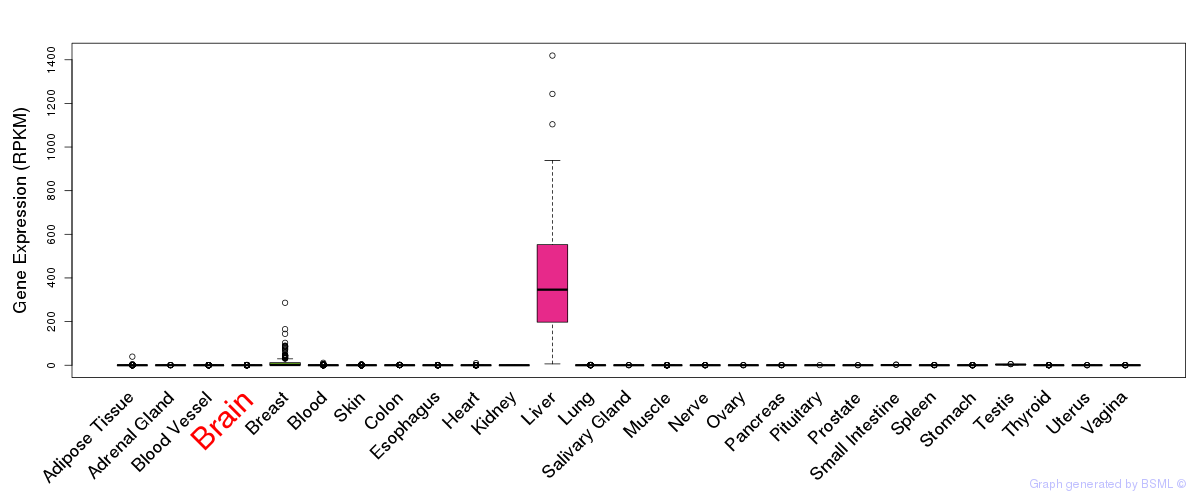
Section II. Transcriptome annotation
General gene expression (GTEx)
Gene expression during devlopment (BrainCloud)
Footnote:
A total of 269 time points ploted, with n=38 fetal samples (x=1:38). Each triangle represents one time point.
Gene expression of temporal and spatial changes (BrainSpan)
Footnote:
SC: sub-cortical regions; SM: sensory-motor regions; FC: frontal cortex; and TP: temporal-parietal cortex
ST1: fetal (13 - 26 postconception weeks), ST2: early infancy to late childhood (4 months to 11 years), and ST3: adolescence to adulthood (13 - 23 years)
The bar shown representes the lower 25% and upper 25% of the expression distribution.
Top co-expressed genes in brain regions
| Top 10 positively co-expressed genes | ||
| Gene | Pearson's Correlation | Spearman's Correlation |
| HAUS6 | 0.92 | 0.92 |
| RYK | 0.92 | 0.89 |
| SP3 | 0.91 | 0.90 |
| PRPF38A | 0.91 | 0.86 |
| EPB41L5 | 0.91 | 0.90 |
| CTNND1 | 0.91 | 0.90 |
| LSM14A | 0.90 | 0.91 |
| SMAD4 | 0.90 | 0.90 |
| NUP205 | 0.90 | 0.88 |
| VEZF1 | 0.90 | 0.93 |
| Top 10 negatively co-expressed genes | ||
| Gene | Pearson's Correlation | Spearman's Correlation |
| MT-CO2 | -0.60 | -0.76 |
| AF347015.31 | -0.60 | -0.75 |
| C5orf53 | -0.59 | -0.65 |
| IFI27 | -0.59 | -0.75 |
| FXYD1 | -0.59 | -0.74 |
| AF347015.27 | -0.59 | -0.72 |
| AF347015.33 | -0.57 | -0.70 |
| CXCL14 | -0.57 | -0.74 |
| AF347015.8 | -0.57 | -0.73 |
| CA4 | -0.57 | -0.66 |
Section III. Gene Ontology annotation
| Molecular function | GO term | Evidence | Neuro keywords | PubMed ID |
|---|---|---|---|---|
| GO:0004838 | tyrosine transaminase activity | IEA | glutamate (GO term level: 6) | - |
| GO:0004838 | tyrosine transaminase activity | NAS | glutamate (GO term level: 6) | 1973834 |
| GO:0016847 | 1-aminocyclopropane-1-carboxylate synthase activity | IEA | - | |
| GO:0030170 | pyridoxal phosphate binding | IEA | - | |
| Biological process | GO term | Evidence | Neuro keywords | PubMed ID |
| GO:0009074 | aromatic amino acid family catabolic process | IEA | - | |
| GO:0006519 | cellular amino acid and derivative metabolic process | IEA | - | |
| GO:0009058 | biosynthetic process | IEA | - | |
| GO:0006559 | L-phenylalanine catabolic process | NAS | - | |
| GO:0006572 | tyrosine catabolic process | NAS | - | |
| Cellular component | GO term | Evidence | Neuro keywords | PubMed ID |
| GO:0005575 | cellular_component | ND | - | |
| GO:0005739 | mitochondrion | IEA | - |
Section V. Pathway annotation
| Pathway name | Pathway size | # SZGR 2.0 genes in pathway | Info |
|---|---|---|---|
| KEGG CYSTEINE AND METHIONINE METABOLISM | 34 | 24 | All SZGR 2.0 genes in this pathway |
| KEGG TYROSINE METABOLISM | 42 | 30 | All SZGR 2.0 genes in this pathway |
| KEGG PHENYLALANINE METABOLISM | 18 | 12 | All SZGR 2.0 genes in this pathway |
| PID HNF3B PATHWAY | 45 | 37 | All SZGR 2.0 genes in this pathway |
| REACTOME METABOLISM OF AMINO ACIDS AND DERIVATIVES | 200 | 136 | All SZGR 2.0 genes in this pathway |
| HERNANDEZ MITOTIC ARREST BY DOCETAXEL 2 DN | 19 | 13 | All SZGR 2.0 genes in this pathway |
| XU AKT1 TARGETS 6HR | 27 | 18 | All SZGR 2.0 genes in this pathway |
| HSIAO LIVER SPECIFIC GENES | 244 | 154 | All SZGR 2.0 genes in this pathway |
| BLALOCK ALZHEIMERS DISEASE UP | 1691 | 1088 | All SZGR 2.0 genes in this pathway |
| SU LIVER | 55 | 32 | All SZGR 2.0 genes in this pathway |
| LEIN MEDULLA MARKERS | 81 | 48 | All SZGR 2.0 genes in this pathway |
| MARSON BOUND BY FOXP3 UNSTIMULATED | 1229 | 713 | All SZGR 2.0 genes in this pathway |
| KONDO PROSTATE CANCER WITH H3K27ME3 | 196 | 93 | All SZGR 2.0 genes in this pathway |
| SMID BREAST CANCER LUMINAL A UP | 84 | 52 | All SZGR 2.0 genes in this pathway |
| SMID BREAST CANCER BASAL DN | 701 | 446 | All SZGR 2.0 genes in this pathway |
| LABBE WNT3A TARGETS UP | 112 | 71 | All SZGR 2.0 genes in this pathway |
| LABBE TARGETS OF TGFB1 AND WNT3A UP | 111 | 70 | All SZGR 2.0 genes in this pathway |
| MOOTHA HUMAN MITODB 6 2002 | 429 | 260 | All SZGR 2.0 genes in this pathway |
| MOOTHA MITOCHONDRIA | 447 | 277 | All SZGR 2.0 genes in this pathway |
| YOSHIMURA MAPK8 TARGETS UP | 1305 | 895 | All SZGR 2.0 genes in this pathway |
| CHIANG LIVER CANCER SUBCLASS PROLIFERATION DN | 179 | 97 | All SZGR 2.0 genes in this pathway |
| CAIRO HEPATOBLASTOMA DN | 267 | 160 | All SZGR 2.0 genes in this pathway |
| SERVITJA ISLET HNF1A TARGETS DN | 109 | 71 | All SZGR 2.0 genes in this pathway |
| GUO TARGETS OF IRS1 AND IRS2 | 98 | 67 | All SZGR 2.0 genes in this pathway |
| RATTENBACHER BOUND BY CELF1 | 467 | 251 | All SZGR 2.0 genes in this pathway |
| ZWANG TRANSIENTLY UP BY 2ND EGF PULSE ONLY | 1725 | 838 | All SZGR 2.0 genes in this pathway |