Gene Page: LTBP4
Summary ?
| GeneID | 8425 |
| Symbol | LTBP4 |
| Synonyms | ARCL1C|LTBP-4|LTBP4L|LTBP4S |
| Description | latent transforming growth factor beta binding protein 4 |
| Reference | MIM:604710|HGNC:HGNC:6717|Ensembl:ENSG00000090006|HPRD:05274|Vega:OTTHUMG00000182635 |
| Gene type | protein-coding |
| Map location | 19q13.1-q13.2 |
| Pascal p-value | 0.656 |
| Fetal beta | -0.262 |
| DMG | 1 (# studies) |
| eGene | Cerebellar Hemisphere Cerebellum Myers' cis & trans Meta |
| Support | Ascano FMRP targets |
Gene in Data Sources
| Gene set name | Method of gene set | Description | Info |
|---|---|---|---|
| CV:PGCnp | Genome-wide Association Study | GWAS | |
| DMG:Wockner_2014 | Genome-wide DNA methylation analysis | This dataset includes 4641 differentially methylated probes corresponding to 2929 unique genes between schizophrenia patients (n=24) and controls (n=24). | 2 |
Section I. Genetics and epigenetics annotation
 Differentially methylated gene
| Probe | Chromosome | Position | Nearest gene | P (dis) | Beta (dis) | FDR (dis) | Study |
|---|---|---|---|---|---|---|---|
| cg24836281 | 19 | 41100790 | LTBP4 | 2.607E-4 | 0.508 | 0.038 | DMG:Wockner_2014 |
| cg18834361 | 19 | 41131889 | LTBP4 | 4.345E-4 | 0.266 | 0.045 | DMG:Wockner_2014 |
eQTL annotation
| SNP ID | Chromosome | Position | eGene | Gene Entrez ID | pvalue | qvalue | TSS distance | eQTL type |
|---|---|---|---|---|---|---|---|---|
| rs11066476 | chr12 | 113465366 | LTBP4 | 8425 | 0.01 | trans | ||
| rs2444983 | chr15 | 33443919 | LTBP4 | 8425 | 0.19 | trans |
Section II. Transcriptome annotation
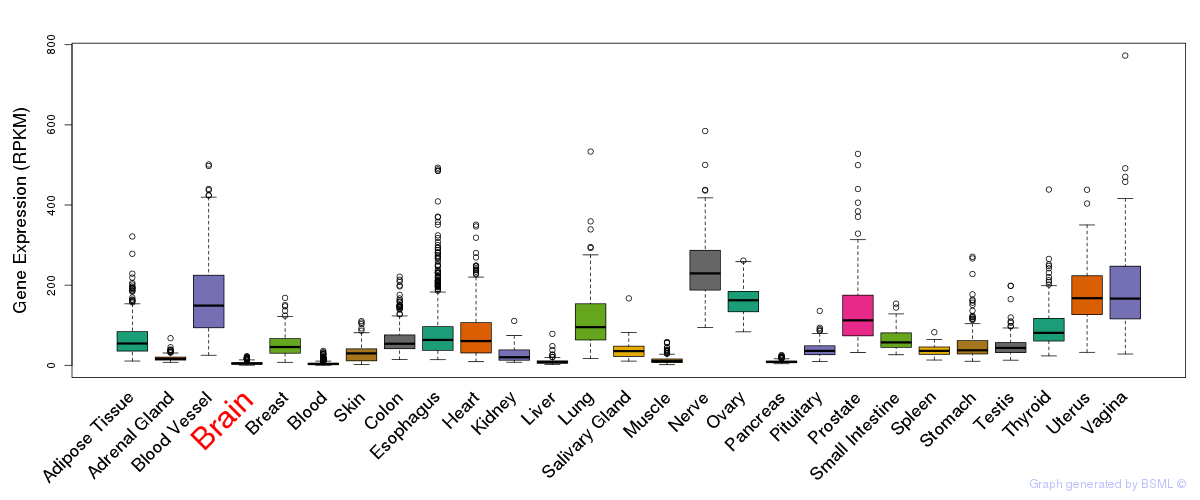
General gene expression (GTEx)
Gene expression during devlopment (BrainCloud)
Footnote:
A total of 269 time points ploted, with n=38 fetal samples (x=1:38). Each triangle represents one time point.
Gene expression of temporal and spatial changes (BrainSpan)
Footnote:
SC: sub-cortical regions; SM: sensory-motor regions; FC: frontal cortex; and TP: temporal-parietal cortex
ST1: fetal (13 - 26 postconception weeks), ST2: early infancy to late childhood (4 months to 11 years), and ST3: adolescence to adulthood (13 - 23 years)
The bar shown representes the lower 25% and upper 25% of the expression distribution.
Top co-expressed genes in brain regions
| Top 10 positively co-expressed genes | ||
| Gene | Pearson's Correlation | Spearman's Correlation |
| CLASP2 | 0.94 | 0.94 |
| AASDHPPT | 0.93 | 0.93 |
| SHOC2 | 0.92 | 0.93 |
| KPNA3 | 0.92 | 0.94 |
| SLC25A36 | 0.92 | 0.93 |
| ARFGEF1 | 0.92 | 0.94 |
| IBTK | 0.91 | 0.92 |
| RABGEF1 | 0.91 | 0.92 |
| MORC3 | 0.91 | 0.93 |
| FAM160B1 | 0.91 | 0.93 |
| Top 10 negatively co-expressed genes | ||
| Gene | Pearson's Correlation | Spearman's Correlation |
| MT-CO2 | -0.78 | -0.81 |
| FXYD1 | -0.77 | -0.80 |
| AF347015.31 | -0.76 | -0.79 |
| AF347015.33 | -0.75 | -0.76 |
| AF347015.8 | -0.75 | -0.79 |
| MT-CYB | -0.75 | -0.77 |
| HIGD1B | -0.74 | -0.79 |
| AF347015.27 | -0.73 | -0.76 |
| AF347015.21 | -0.72 | -0.77 |
| AF347015.2 | -0.72 | -0.75 |
Section V. Pathway annotation
| Pathway name | Pathway size | # SZGR 2.0 genes in pathway | Info |
|---|---|---|---|
| PARENT MTOR SIGNALING UP | 567 | 375 | All SZGR 2.0 genes in this pathway |
| DAVICIONI MOLECULAR ARMS VS ERMS DN | 182 | 111 | All SZGR 2.0 genes in this pathway |
| ZHOU INFLAMMATORY RESPONSE LIVE UP | 485 | 293 | All SZGR 2.0 genes in this pathway |
| MULLIGHAN NPM1 MUTATED SIGNATURE 1 DN | 126 | 86 | All SZGR 2.0 genes in this pathway |
| MULLIGHAN NPM1 MUTATED SIGNATURE 2 DN | 77 | 46 | All SZGR 2.0 genes in this pathway |
| MULLIGHAN NPM1 SIGNATURE 3 DN | 162 | 116 | All SZGR 2.0 genes in this pathway |
| ZHOU INFLAMMATORY RESPONSE FIMA UP | 544 | 308 | All SZGR 2.0 genes in this pathway |
| ZHOU INFLAMMATORY RESPONSE LPS UP | 431 | 237 | All SZGR 2.0 genes in this pathway |
| BERENJENO TRANSFORMED BY RHOA DN | 394 | 258 | All SZGR 2.0 genes in this pathway |
| DARWICHE SKIN TUMOR PROMOTER UP | 142 | 96 | All SZGR 2.0 genes in this pathway |
| DARWICHE PAPILLOMA RISK LOW DN | 165 | 107 | All SZGR 2.0 genes in this pathway |
| DARWICHE PAPILLOMA RISK HIGH DN | 180 | 110 | All SZGR 2.0 genes in this pathway |
| DARWICHE SQUAMOUS CELL CARCINOMA UP | 146 | 104 | All SZGR 2.0 genes in this pathway |
| WONG ENDMETRIUM CANCER DN | 82 | 53 | All SZGR 2.0 genes in this pathway |
| DAIRKEE TERT TARGETS UP | 380 | 213 | All SZGR 2.0 genes in this pathway |
| MAGRANGEAS MULTIPLE MYELOMA IGLL VS IGLK DN | 24 | 18 | All SZGR 2.0 genes in this pathway |
| SANSOM APC TARGETS DN | 366 | 238 | All SZGR 2.0 genes in this pathway |
| MOREAUX MULTIPLE MYELOMA BY TACI UP | 412 | 249 | All SZGR 2.0 genes in this pathway |
| YAMAZAKI TCEB3 TARGETS DN | 215 | 132 | All SZGR 2.0 genes in this pathway |
| MCDOWELL ACUTE LUNG INJURY DN | 48 | 33 | All SZGR 2.0 genes in this pathway |
| ACEVEDO LIVER TUMOR VS NORMAL ADJACENT TISSUE DN | 274 | 165 | All SZGR 2.0 genes in this pathway |
| BOQUEST STEM CELL CULTURED VS FRESH UP | 425 | 298 | All SZGR 2.0 genes in this pathway |
| WEST ADRENOCORTICAL TUMOR DN | 546 | 362 | All SZGR 2.0 genes in this pathway |
| SWEET LUNG CANCER KRAS DN | 435 | 289 | All SZGR 2.0 genes in this pathway |
| MILI PSEUDOPODIA CHEMOTAXIS DN | 457 | 302 | All SZGR 2.0 genes in this pathway |
| POOLA INVASIVE BREAST CANCER DN | 134 | 83 | All SZGR 2.0 genes in this pathway |
| MEISSNER NPC HCP WITH H3K4ME2 | 491 | 319 | All SZGR 2.0 genes in this pathway |
| BRUINS UVC RESPONSE VIA TP53 GROUP B | 549 | 316 | All SZGR 2.0 genes in this pathway |
| BRUINS UVC RESPONSE LATE | 1137 | 655 | All SZGR 2.0 genes in this pathway |
| LEE BMP2 TARGETS UP | 745 | 475 | All SZGR 2.0 genes in this pathway |
| PURBEY TARGETS OF CTBP1 NOT SATB1 UP | 344 | 215 | All SZGR 2.0 genes in this pathway |
| KUMAR PATHOGEN LOAD BY MACROPHAGES | 275 | 155 | All SZGR 2.0 genes in this pathway |
| KUMAR AUTOPHAGY NETWORK | 71 | 46 | All SZGR 2.0 genes in this pathway |
| LIM MAMMARY STEM CELL UP | 489 | 314 | All SZGR 2.0 genes in this pathway |
| LIM MAMMARY LUMINAL MATURE DN | 99 | 74 | All SZGR 2.0 genes in this pathway |
| NABA ECM GLYCOPROTEINS | 196 | 99 | All SZGR 2.0 genes in this pathway |
| NABA CORE MATRISOME | 275 | 148 | All SZGR 2.0 genes in this pathway |
| NABA MATRISOME | 1028 | 559 | All SZGR 2.0 genes in this pathway |