Gene Page: KCNQ5
Summary ?
| GeneID | 56479 |
| Symbol | KCNQ5 |
| Synonyms | Kv7.5 |
| Description | potassium voltage-gated channel subfamily Q member 5 |
| Reference | MIM:607357|HGNC:HGNC:6299|Ensembl:ENSG00000185760|HPRD:16241|Vega:OTTHUMG00000015020 |
| Gene type | protein-coding |
| Map location | 6q14 |
| Pascal p-value | 9.065E-4 |
| Fetal beta | -0.297 |
| Support | CompositeSet |
Gene in Data Sources
| Gene set name | Method of gene set | Description | Info |
|---|---|---|---|
| CV:GWAScat | Genome-wide Association Studies | This data set includes 560 SNPs associated with schizophrenia. A total of 486 genes were mapped to these SNPs within 50kb. | |
| CV:GWASdb | Genome-wide Association Studies | GWASdb records for schizophrenia | |
| CV:PGC128 | Genome-wide Association Study | A multi-stage schizophrenia GWAS of up to 36,989 cases and 113,075 controls. Reported by the Schizophrenia Working Group of PGC. 128 independent associations spanning 108 loci | |
| CV:PGCnp | Genome-wide Association Study | GWAS | |
| DNM:Fromer_2014 | Whole Exome Sequencing analysis | This study reported a WES study of 623 schizophrenia trios, reporting DNMs using genomic DNA. | |
| PMID:cooccur | High-throughput literature-search | Systematic search in PubMed for genes co-occurring with SCZ keywords. A total of 3027 genes were included. | |
| Literature | High-throughput literature-search | Co-occurance with Schizophrenia keywords: schizophrenia,schizophrenic,schizophrenias | Click to show details |
| GO_Annotation | Mapping neuro-related keywords to Gene Ontology annotations | Hits with neuro-related keywords: 1 | |
| Network | Shortest path distance of core genes in the Human protein-protein interaction network | Contribution to shortest path in PPI network: 0.217 |
Section I. Genetics and epigenetics annotation
 CV:PGC128
| SNP ID | Chromosome | Position | Allele | P | Function | Gene | Up/Down Distance |
|---|---|---|---|---|---|---|---|
| rs1339227 | chr6 | 73155701 | TC | 6.86E-8 | intergenic | RIMS1,KCNQ5 | dist=42856;dist=175870 |
DNM table
| Gene | Chromosome | Position | Ref | Alt | Transcript | AA change | Mutation type | Sift | CG46 | Trait | Study |
|---|---|---|---|---|---|---|---|---|---|---|---|
| KCNQ5 | chr6 | 73839517 | A | C | NM_001160130 NM_001160132 NM_001160132 NM_001160133 NM_001160133 NM_001160134 NM_019842 | . . p.408K>Q . p.417K>Q . . | intronic splice missense splice missense intronic intronic | Schizophrenia | DNM:Fromer_2014 |
Section II. Transcriptome annotation
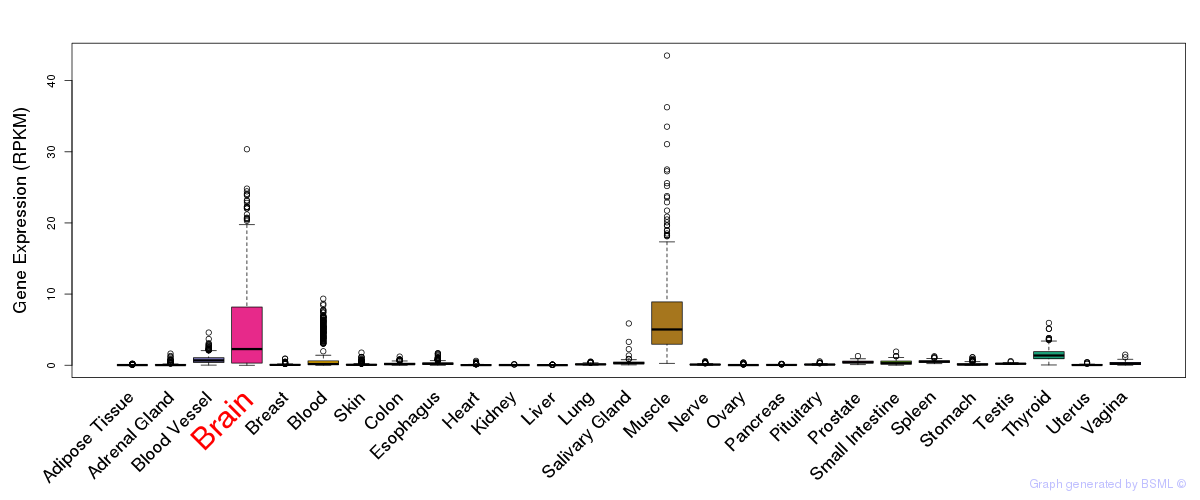
General gene expression (GTEx)
Gene expression during devlopment (BrainCloud)
Footnote:
A total of 269 time points ploted, with n=38 fetal samples (x=1:38). Each triangle represents one time point.
Gene expression of temporal and spatial changes (BrainSpan)
Footnote:
SC: sub-cortical regions; SM: sensory-motor regions; FC: frontal cortex; and TP: temporal-parietal cortex
ST1: fetal (13 - 26 postconception weeks), ST2: early infancy to late childhood (4 months to 11 years), and ST3: adolescence to adulthood (13 - 23 years)
The bar shown representes the lower 25% and upper 25% of the expression distribution.
Top co-expressed genes in brain regions
| Top 10 positively co-expressed genes | ||
| Gene | Pearson's Correlation | Spearman's Correlation |
| AK7 | 0.90 | 0.55 |
| WDR66 | 0.88 | 0.63 |
| C10orf79 | 0.88 | 0.45 |
| AC079354.2 | 0.88 | 0.55 |
| WDR63 | 0.87 | 0.36 |
| WDR52 | 0.87 | 0.53 |
| DNAH3 | 0.87 | 0.35 |
| TCTEX1D1 | 0.87 | 0.36 |
| C3orf25 | 0.86 | 0.43 |
| RP11-282K6.1 | 0.86 | 0.54 |
| Top 10 negatively co-expressed genes | ||
| Gene | Pearson's Correlation | Spearman's Correlation |
| ENHO | -0.20 | -0.28 |
| DUSP1 | -0.20 | -0.26 |
| OLFM2 | -0.19 | -0.30 |
| RPS10 | -0.19 | -0.38 |
| HYAL2 | -0.18 | -0.39 |
| AC136932.2 | -0.18 | -0.27 |
| AC008629.2 | -0.18 | -0.20 |
| IMPA2 | -0.18 | -0.30 |
| PLAC9 | -0.17 | -0.13 |
| SIGIRR | -0.17 | -0.32 |
Section III. Gene Ontology annotation
| Molecular function | GO term | Evidence | Neuro keywords | PubMed ID |
|---|---|---|---|---|
| GO:0005242 | inward rectifier potassium channel activity | TAS | 10787416 | |
| GO:0005244 | voltage-gated ion channel activity | IEA | - | |
| GO:0030955 | potassium ion binding | IEA | - | |
| Biological process | GO term | Evidence | Neuro keywords | PubMed ID |
| GO:0007268 | synaptic transmission | TAS | neuron, Synap, Neurotransmitter (GO term level: 6) | 10787416 |
| GO:0006461 | protein complex assembly | NAS | 10787416 | |
| GO:0006811 | ion transport | IEA | - | |
| GO:0006813 | potassium ion transport | IEA | - | |
| Cellular component | GO term | Evidence | Neuro keywords | PubMed ID |
| GO:0016020 | membrane | IEA | - | |
| GO:0016021 | integral to membrane | IEA | - | |
| GO:0008076 | voltage-gated potassium channel complex | TAS | 10787416 |
Section V. Pathway annotation
| Pathway name | Pathway size | # SZGR 2.0 genes in pathway | Info |
|---|---|---|---|
| REACTOME NEURONAL SYSTEM | 279 | 221 | All SZGR 2.0 genes in this pathway |
| REACTOME VOLTAGE GATED POTASSIUM CHANNELS | 43 | 32 | All SZGR 2.0 genes in this pathway |
| REACTOME POTASSIUM CHANNELS | 98 | 68 | All SZGR 2.0 genes in this pathway |
| KINSEY TARGETS OF EWSR1 FLII FUSION UP | 1278 | 748 | All SZGR 2.0 genes in this pathway |
| SHETH LIVER CANCER VS TXNIP LOSS PAM4 | 261 | 153 | All SZGR 2.0 genes in this pathway |
| BENPORATH EED TARGETS | 1062 | 725 | All SZGR 2.0 genes in this pathway |
| BENPORATH ES WITH H3K27ME3 | 1118 | 744 | All SZGR 2.0 genes in this pathway |
| SAFFORD T LYMPHOCYTE ANERGY | 87 | 54 | All SZGR 2.0 genes in this pathway |
| BILD MYC ONCOGENIC SIGNATURE | 206 | 117 | All SZGR 2.0 genes in this pathway |
| BONCI TARGETS OF MIR15A AND MIR16 1 | 91 | 75 | All SZGR 2.0 genes in this pathway |
| BREDEMEYER RAG SIGNALING NOT VIA ATM DN | 57 | 34 | All SZGR 2.0 genes in this pathway |
| BOYLAN MULTIPLE MYELOMA PCA3 UP | 80 | 54 | All SZGR 2.0 genes in this pathway |
| TORCHIA TARGETS OF EWSR1 FLI1 FUSION DN | 321 | 200 | All SZGR 2.0 genes in this pathway |
| ACEVEDO FGFR1 TARGETS IN PROSTATE CANCER MODEL DN | 308 | 187 | All SZGR 2.0 genes in this pathway |
Section VI. microRNA annotation
| miRNA family | Target position | miRNA ID | miRNA seq | ||
|---|---|---|---|---|---|
| UTR start | UTR end | Match method | |||
| miR-135 | 36 | 42 | 1A | hsa-miR-135a | UAUGGCUUUUUAUUCCUAUGUGA |
| hsa-miR-135b | UAUGGCUUUUCAUUCCUAUGUG | ||||
| miR-15/16/195/424/497 | 434 | 440 | 1A | hsa-miR-15abrain | UAGCAGCACAUAAUGGUUUGUG |
| hsa-miR-16brain | UAGCAGCACGUAAAUAUUGGCG | ||||
| hsa-miR-15bbrain | UAGCAGCACAUCAUGGUUUACA | ||||
| hsa-miR-195SZ | UAGCAGCACAGAAAUAUUGGC | ||||
| hsa-miR-424 | CAGCAGCAAUUCAUGUUUUGAA | ||||
| hsa-miR-497 | CAGCAGCACACUGUGGUUUGU | ||||
| miR-190 | 42 | 49 | 1A,m8 | hsa-miR-190 | UGAUAUGUUUGAUAUAUUAGGU |
| miR-503 | 434 | 440 | 1A | hsa-miR-503 | UAGCAGCGGGAACAGUUCUGCAG |
- SZ: miRNAs which differentially expressed in brain cortex of schizophrenia patients comparing with control samples using microarray. Click here to see the list of SZ related miRNAs.
- Brain: miRNAs which are expressed in brain based on miRNA microarray expression studies. Click here to see the list of brain related miRNAs.