Gene Page: PRMT3
Summary ?
| GeneID | 10196 |
| Symbol | PRMT3 |
| Synonyms | HRMT1L3 |
| Description | protein arginine methyltransferase 3 |
| Reference | MIM:603190|HGNC:HGNC:30163|Ensembl:ENSG00000185238|HPRD:11934|Vega:OTTHUMG00000166022 |
| Gene type | protein-coding |
| Map location | 11p15.1 |
| Pascal p-value | 0.778 |
| Sherlock p-value | 0.625 |
| Fetal beta | -0.114 |
| DMG | 1 (# studies) |
| eGene | Myers' cis & trans |
Gene in Data Sources
| Gene set name | Method of gene set | Description | Info |
|---|---|---|---|
| CV:PGCnp | Genome-wide Association Study | GWAS | |
| DMG:Jaffe_2016 | Genome-wide DNA methylation analysis | This dataset includes 2,104 probes/CpGs associated with SZ patients (n=108) compared to 136 controls at Bonferroni-adjusted P < 0.05. | 1 |
Section I. Genetics and epigenetics annotation
 Differentially methylated gene
| Probe | Chromosome | Position | Nearest gene | P (dis) | Beta (dis) | FDR (dis) | Study |
|---|---|---|---|---|---|---|---|
| cg08934607 | 11 | 20409647 | PRMT3 | 1.21E-10 | -0.023 | 4.83E-7 | DMG:Jaffe_2016 |
eQTL annotation
| SNP ID | Chromosome | Position | eGene | Gene Entrez ID | pvalue | qvalue | TSS distance | eQTL type |
|---|---|---|---|---|---|---|---|---|
| rs10147611 | chr14 | 54234752 | PRMT3 | 10196 | 0.1 | trans |
Section II. Transcriptome annotation
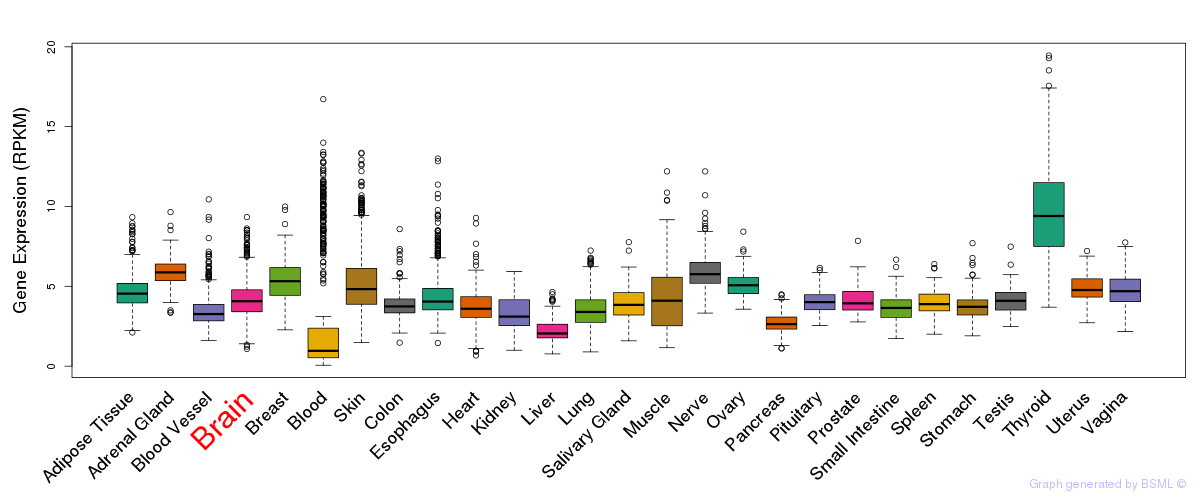
General gene expression (GTEx)
Gene expression during devlopment (BrainCloud)
Footnote:
A total of 269 time points ploted, with n=38 fetal samples (x=1:38). Each triangle represents one time point.
Gene expression of temporal and spatial changes (BrainSpan)
Footnote:
SC: sub-cortical regions; SM: sensory-motor regions; FC: frontal cortex; and TP: temporal-parietal cortex
ST1: fetal (13 - 26 postconception weeks), ST2: early infancy to late childhood (4 months to 11 years), and ST3: adolescence to adulthood (13 - 23 years)
The bar shown representes the lower 25% and upper 25% of the expression distribution.
Top co-expressed genes in brain regions
| Top 10 positively co-expressed genes | ||
| Gene | Pearson's Correlation | Spearman's Correlation |
| SPEN | 0.82 | 0.72 |
| KIAA1305 | 0.81 | 0.78 |
| ZFYVE26 | 0.80 | 0.74 |
| ZNF445 | 0.80 | 0.73 |
| TUG1 | 0.80 | 0.73 |
| UBR5 | 0.80 | 0.77 |
| MLL | 0.80 | 0.72 |
| PLXNA3 | 0.80 | 0.75 |
| PHC1 | 0.80 | 0.74 |
| ASXL1 | 0.80 | 0.73 |
| Top 10 negatively co-expressed genes | ||
| Gene | Pearson's Correlation | Spearman's Correlation |
| C5orf53 | -0.59 | -0.64 |
| CA4 | -0.57 | -0.66 |
| AF347015.31 | -0.55 | -0.65 |
| FBXO2 | -0.55 | -0.58 |
| IFI27 | -0.54 | -0.65 |
| ACOT13 | -0.54 | -0.58 |
| PTH1R | -0.53 | -0.57 |
| AF347015.27 | -0.53 | -0.61 |
| TNFSF12 | -0.53 | -0.58 |
| HIGD1B | -0.53 | -0.67 |
Section V. Pathway annotation
| Pathway name | Pathway size | # SZGR 2.0 genes in pathway | Info |
|---|---|---|---|
| SENGUPTA NASOPHARYNGEAL CARCINOMA WITH LMP1 UP | 408 | 247 | All SZGR 2.0 genes in this pathway |
| DODD NASOPHARYNGEAL CARCINOMA DN | 1375 | 806 | All SZGR 2.0 genes in this pathway |
| SCHLOSSER MYC TARGETS REPRESSED BY SERUM | 159 | 93 | All SZGR 2.0 genes in this pathway |
| DACOSTA UV RESPONSE VIA ERCC3 DN | 855 | 609 | All SZGR 2.0 genes in this pathway |
| DACOSTA UV RESPONSE VIA ERCC3 COMMON DN | 483 | 336 | All SZGR 2.0 genes in this pathway |
| TSUNODA CISPLATIN RESISTANCE DN | 51 | 38 | All SZGR 2.0 genes in this pathway |
| PUJANA BRCA1 PCC NETWORK | 1652 | 1023 | All SZGR 2.0 genes in this pathway |
| PUJANA ATM PCC NETWORK | 1442 | 892 | All SZGR 2.0 genes in this pathway |
| PUJANA CHEK2 PCC NETWORK | 779 | 480 | All SZGR 2.0 genes in this pathway |
| NUYTTEN NIPP1 TARGETS UP | 769 | 437 | All SZGR 2.0 genes in this pathway |
| WEI MYCN TARGETS WITH E BOX | 795 | 478 | All SZGR 2.0 genes in this pathway |
| BENPORATH ES 1 | 379 | 235 | All SZGR 2.0 genes in this pathway |
| MATSUDA NATURAL KILLER DIFFERENTIATION | 475 | 313 | All SZGR 2.0 genes in this pathway |
| KRIGE RESPONSE TO TOSEDOSTAT 6HR UP | 953 | 554 | All SZGR 2.0 genes in this pathway |
| KRIGE RESPONSE TO TOSEDOSTAT 24HR DN | 1011 | 592 | All SZGR 2.0 genes in this pathway |
| CAIRO HEPATOBLASTOMA CLASSES UP | 605 | 377 | All SZGR 2.0 genes in this pathway |
| WONG EMBRYONIC STEM CELL CORE | 335 | 193 | All SZGR 2.0 genes in this pathway |
| PILON KLF1 TARGETS DN | 1972 | 1213 | All SZGR 2.0 genes in this pathway |
| LEE BMP2 TARGETS DN | 882 | 538 | All SZGR 2.0 genes in this pathway |