Gene Page: EXTL2
Summary ?
| GeneID | 2135 |
| Symbol | EXTL2 |
| Synonyms | EXTR2 |
| Description | exostosin-like glycosyltransferase 2 |
| Reference | MIM:602411|HGNC:HGNC:3516|Ensembl:ENSG00000162694|HPRD:03876|Vega:OTTHUMG00000011814 |
| Gene type | protein-coding |
| Map location | 1p21 |
| Pascal p-value | 0.001 |
| Sherlock p-value | 4.026E-4 |
| Fetal beta | -0.502 |
| eGene | Meta |
Gene in Data Sources
| Gene set name | Method of gene set | Description | Info |
|---|---|---|---|
| CV:PGCnp | Genome-wide Association Study | GWAS |
Section I. Genetics and epigenetics annotation
Section II. Transcriptome annotation
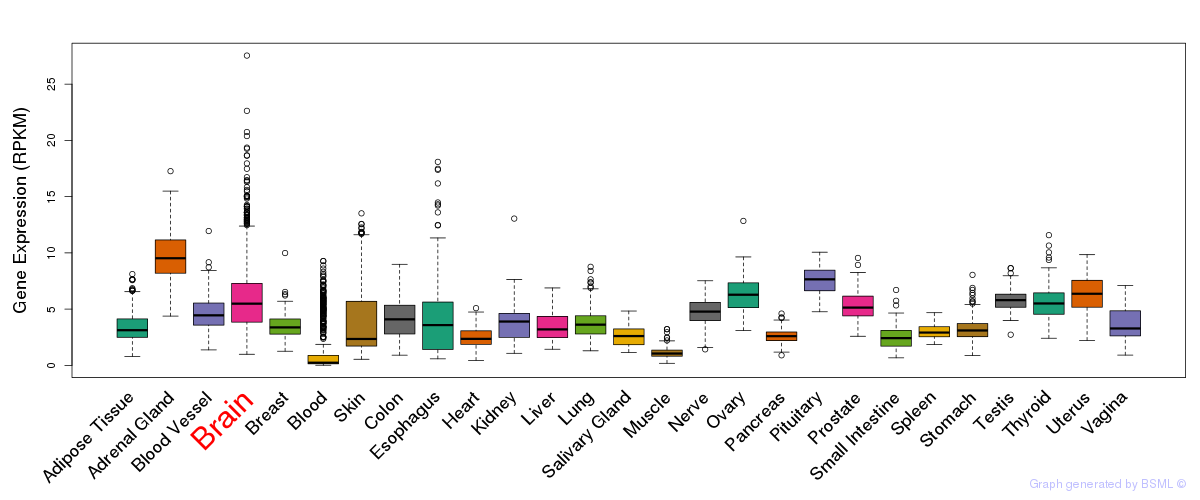
General gene expression (GTEx)
Gene expression during devlopment (BrainCloud)
Footnote:
A total of 269 time points ploted, with n=38 fetal samples (x=1:38). Each triangle represents one time point.
Gene expression of temporal and spatial changes (BrainSpan)
Footnote:
SC: sub-cortical regions; SM: sensory-motor regions; FC: frontal cortex; and TP: temporal-parietal cortex
ST1: fetal (13 - 26 postconception weeks), ST2: early infancy to late childhood (4 months to 11 years), and ST3: adolescence to adulthood (13 - 23 years)
The bar shown representes the lower 25% and upper 25% of the expression distribution.
Top co-expressed genes in brain regions
| Top 10 positively co-expressed genes | ||
| Gene | Pearson's Correlation | Spearman's Correlation |
| DOCK11 | 0.72 | 0.70 |
| POU3F4 | 0.72 | 0.58 |
| PRKD3 | 0.70 | 0.55 |
| RBM23 | 0.69 | 0.72 |
| RACGAP1P | 0.69 | 0.70 |
| SPATA13 | 0.69 | 0.55 |
| MAP3K1 | 0.69 | 0.58 |
| CENPO | 0.69 | 0.66 |
| COL22A1 | 0.68 | 0.51 |
| GCNT2 | 0.68 | 0.66 |
| Top 10 negatively co-expressed genes | ||
| Gene | Pearson's Correlation | Spearman's Correlation |
| AF347015.33 | -0.44 | -0.60 |
| MT-CO2 | -0.44 | -0.62 |
| AF347015.31 | -0.43 | -0.60 |
| AF347015.27 | -0.43 | -0.60 |
| AF347015.8 | -0.42 | -0.60 |
| MT-CYB | -0.42 | -0.59 |
| AF347015.2 | -0.42 | -0.59 |
| FXYD1 | -0.41 | -0.57 |
| AF347015.15 | -0.41 | -0.57 |
| AF347015.26 | -0.41 | -0.57 |
Section V. Pathway annotation
| Pathway name | Pathway size | # SZGR 2.0 genes in pathway | Info |
|---|---|---|---|
| KEGG GLYCOSAMINOGLYCAN BIOSYNTHESIS HEPARAN SULFATE | 26 | 16 | All SZGR 2.0 genes in this pathway |
| BERTUCCI MEDULLARY VS DUCTAL BREAST CANCER DN | 169 | 118 | All SZGR 2.0 genes in this pathway |
| CHARAFE BREAST CANCER LUMINAL VS MESENCHYMAL DN | 460 | 312 | All SZGR 2.0 genes in this pathway |
| WAMUNYOKOLI OVARIAN CANCER LMP DN | 199 | 124 | All SZGR 2.0 genes in this pathway |
| BUYTAERT PHOTODYNAMIC THERAPY STRESS DN | 637 | 377 | All SZGR 2.0 genes in this pathway |
| PASQUALUCCI LYMPHOMA BY GC STAGE UP | 283 | 177 | All SZGR 2.0 genes in this pathway |
| BENPORATH NANOG TARGETS | 988 | 594 | All SZGR 2.0 genes in this pathway |
| GEORGES CELL CYCLE MIR192 TARGETS | 62 | 46 | All SZGR 2.0 genes in this pathway |
| GEORGES TARGETS OF MIR192 AND MIR215 | 893 | 528 | All SZGR 2.0 genes in this pathway |
| SASAKI ADULT T CELL LEUKEMIA | 176 | 122 | All SZGR 2.0 genes in this pathway |
| ZHAN MULTIPLE MYELOMA UP | 64 | 46 | All SZGR 2.0 genes in this pathway |
| TAVOR CEBPA TARGETS UP | 48 | 36 | All SZGR 2.0 genes in this pathway |
| WELCSH BRCA1 TARGETS UP | 198 | 132 | All SZGR 2.0 genes in this pathway |
| BILD SRC ONCOGENIC SIGNATURE | 62 | 38 | All SZGR 2.0 genes in this pathway |
| MARSON BOUND BY FOXP3 UNSTIMULATED | 1229 | 713 | All SZGR 2.0 genes in this pathway |
| EHLERS ANEUPLOIDY UP | 41 | 29 | All SZGR 2.0 genes in this pathway |
| WEST ADRENOCORTICAL TUMOR UP | 294 | 199 | All SZGR 2.0 genes in this pathway |
| QI PLASMACYTOMA DN | 100 | 63 | All SZGR 2.0 genes in this pathway |
| YOSHIMURA MAPK8 TARGETS UP | 1305 | 895 | All SZGR 2.0 genes in this pathway |
| RUIZ TNC TARGETS UP | 153 | 107 | All SZGR 2.0 genes in this pathway |
| PILON KLF1 TARGETS DN | 1972 | 1213 | All SZGR 2.0 genes in this pathway |
| BRUINS UVC RESPONSE VIA TP53 GROUP D | 280 | 158 | All SZGR 2.0 genes in this pathway |
| KOINUMA TARGETS OF SMAD2 OR SMAD3 | 824 | 528 | All SZGR 2.0 genes in this pathway |