Gene Page: PAX2
Summary ?
| GeneID | 5076 |
| Symbol | PAX2 |
| Synonyms | FSGS7|PAPRS |
| Description | paired box 2 |
| Reference | MIM:167409|HGNC:HGNC:8616|Ensembl:ENSG00000075891|HPRD:01330|Vega:OTTHUMG00000018913 |
| Gene type | protein-coding |
| Map location | 10q24 |
| Pascal p-value | 0.701 |
| Fetal beta | -0.141 |
| DMG | 2 (# studies) |
| eGene | Cerebellum |
Gene in Data Sources
| Gene set name | Method of gene set | Description | Info |
|---|---|---|---|
| CV:PGCnp | Genome-wide Association Study | GWAS | |
| DMG:Jaffe_2016 | Genome-wide DNA methylation analysis | This dataset includes 2,104 probes/CpGs associated with SZ patients (n=108) compared to 136 controls at Bonferroni-adjusted P < 0.05. | 2 |
| DMG:Wockner_2014 | Genome-wide DNA methylation analysis | This dataset includes 4641 differentially methylated probes corresponding to 2929 unique genes between schizophrenia patients (n=24) and controls (n=24). | 2 |
| GO_Annotation | Mapping neuro-related keywords to Gene Ontology annotations | Hits with neuro-related keywords: 1 |
Section I. Genetics and epigenetics annotation
 Differentially methylated gene
| Probe | Chromosome | Position | Nearest gene | P (dis) | Beta (dis) | FDR (dis) | Study |
|---|---|---|---|---|---|---|---|
| cg16443970 | 10 | 102504022 | PAX2 | 7.97E-5 | -0.334 | 0.025 | DMG:Wockner_2014 |
| cg05622307 | 10 | 102490373 | PAX2 | 6.83E-8 | -0.014 | 1.67E-5 | DMG:Jaffe_2016 |
Section II. Transcriptome annotation
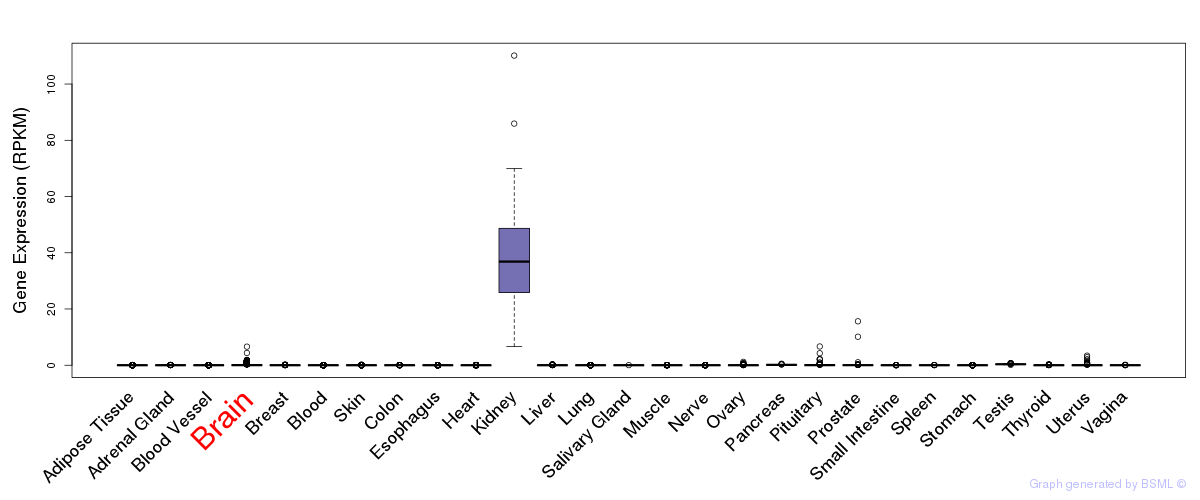
General gene expression (GTEx)
Gene expression during devlopment (BrainCloud)
Footnote:
A total of 269 time points ploted, with n=38 fetal samples (x=1:38). Each triangle represents one time point.
Gene expression of temporal and spatial changes (BrainSpan)
Footnote:
SC: sub-cortical regions; SM: sensory-motor regions; FC: frontal cortex; and TP: temporal-parietal cortex
ST1: fetal (13 - 26 postconception weeks), ST2: early infancy to late childhood (4 months to 11 years), and ST3: adolescence to adulthood (13 - 23 years)
The bar shown representes the lower 25% and upper 25% of the expression distribution.
Top co-expressed genes in brain regions
| Top 10 positively co-expressed genes | ||
| Gene | Pearson's Correlation | Spearman's Correlation |
| USP47 | 0.96 | 0.97 |
| PHF3 | 0.96 | 0.97 |
| AHCTF1 | 0.96 | 0.96 |
| ZNF638 | 0.95 | 0.97 |
| RBM16 | 0.95 | 0.96 |
| SMEK1 | 0.95 | 0.96 |
| RSF1 | 0.95 | 0.96 |
| TPR | 0.95 | 0.96 |
| NIPBL | 0.95 | 0.97 |
| ZCCHC6 | 0.95 | 0.97 |
| Top 10 negatively co-expressed genes | ||
| Gene | Pearson's Correlation | Spearman's Correlation |
| AF347015.31 | -0.77 | -0.87 |
| IFI27 | -0.75 | -0.87 |
| MT-CO2 | -0.75 | -0.86 |
| FXYD1 | -0.74 | -0.84 |
| HIGD1B | -0.74 | -0.86 |
| AF347015.27 | -0.72 | -0.81 |
| AF347015.33 | -0.71 | -0.80 |
| MT-CYB | -0.71 | -0.81 |
| AF347015.8 | -0.71 | -0.83 |
| ENHO | -0.70 | -0.85 |
Section III. Gene Ontology annotation
| Molecular function | GO term | Evidence | Neuro keywords | PubMed ID |
|---|---|---|---|---|
| GO:0003677 | DNA binding | IEA | - | |
| GO:0003677 | DNA binding | TAS | 9106533 | |
| Biological process | GO term | Evidence | Neuro keywords | PubMed ID |
| GO:0007409 | axonogenesis | TAS | neuron, axon, neurite (GO term level: 12) | 9106533 |
| GO:0000122 | negative regulation of transcription from RNA polymerase II promoter | IEA | - | |
| GO:0001657 | ureteric bud development | IEA | - | |
| GO:0001709 | cell fate determination | IEA | - | |
| GO:0006355 | regulation of transcription, DNA-dependent | IEA | - | |
| GO:0007601 | visual perception | TAS | 9106533 | |
| GO:0007275 | multicellular organismal development | IEA | - | |
| GO:0030154 | cell differentiation | IEA | - | |
| GO:0042472 | inner ear morphogenesis | IEA | - | |
| GO:0043010 | camera-type eye development | IEA | - | |
| GO:0045944 | positive regulation of transcription from RNA polymerase II promoter | IEA | - | |
| GO:0045449 | regulation of transcription | IEA | - | |
| Cellular component | GO term | Evidence | Neuro keywords | PubMed ID |
| GO:0005815 | microtubule organizing center | IDA | 18000879 | |
| GO:0005634 | nucleus | IEA | - | |
| GO:0034451 | centriolar satellite | IDA | 18000879 |
Section V. Pathway annotation
| Pathway name | Pathway size | # SZGR 2.0 genes in pathway | Info |
|---|---|---|---|
| CHEMNITZ RESPONSE TO PROSTAGLANDIN E2 DN | 391 | 222 | All SZGR 2.0 genes in this pathway |
| DAVICIONI MOLECULAR ARMS VS ERMS UP | 332 | 228 | All SZGR 2.0 genes in this pathway |
| TAKEDA TARGETS OF NUP98 HOXA9 FUSION 8D DN | 205 | 127 | All SZGR 2.0 genes in this pathway |
| YORDY RECIPROCAL REGULATION BY ETS1 AND SP100 DN | 87 | 48 | All SZGR 2.0 genes in this pathway |
| PUJANA BRCA1 PCC NETWORK | 1652 | 1023 | All SZGR 2.0 genes in this pathway |
| PUJANA ATM PCC NETWORK | 1442 | 892 | All SZGR 2.0 genes in this pathway |
| PUJANA CHEK2 PCC NETWORK | 779 | 480 | All SZGR 2.0 genes in this pathway |
| BENPORATH SUZ12 TARGETS | 1038 | 678 | All SZGR 2.0 genes in this pathway |
| BENPORATH EED TARGETS | 1062 | 725 | All SZGR 2.0 genes in this pathway |
| BENPORATH ES WITH H3K27ME3 | 1118 | 744 | All SZGR 2.0 genes in this pathway |
| BENPORATH PRC2 TARGETS | 652 | 441 | All SZGR 2.0 genes in this pathway |
| SHEPARD CRUSH AND BURN MUTANT DN | 185 | 111 | All SZGR 2.0 genes in this pathway |
| SU PANCREAS | 54 | 30 | All SZGR 2.0 genes in this pathway |
| BROWNE HCMV INFECTION 48HR DN | 504 | 323 | All SZGR 2.0 genes in this pathway |
| KONDO PROSTATE CANCER HCP WITH H3K27ME3 | 97 | 72 | All SZGR 2.0 genes in this pathway |
| SMID BREAST CANCER BASAL DN | 701 | 446 | All SZGR 2.0 genes in this pathway |
| HOFFMANN IMMATURE TO MATURE B LYMPHOCYTE DN | 50 | 36 | All SZGR 2.0 genes in this pathway |
| LI WILMS TUMOR | 27 | 12 | All SZGR 2.0 genes in this pathway |
| MEISSNER BRAIN HCP WITH H3K27ME3 | 269 | 159 | All SZGR 2.0 genes in this pathway |
| MEISSNER NPC HCP WITH H3K4ME2 AND H3K27ME3 | 349 | 234 | All SZGR 2.0 genes in this pathway |
| MIKKELSEN MCV6 HCP WITH H3K27ME3 | 435 | 318 | All SZGR 2.0 genes in this pathway |
| BROWNE HCMV INFECTION 1HR DN | 222 | 147 | All SZGR 2.0 genes in this pathway |
| KRIEG HYPOXIA NOT VIA KDM3A | 770 | 480 | All SZGR 2.0 genes in this pathway |
| ZWANG TRANSIENTLY UP BY 2ND EGF PULSE ONLY | 1725 | 838 | All SZGR 2.0 genes in this pathway |
Section VI. microRNA annotation
| miRNA family | Target position | miRNA ID | miRNA seq | ||
|---|---|---|---|---|---|
| UTR start | UTR end | Match method | |||
| miR-129-5p | 1132 | 1138 | m8 | hsa-miR-129brain | CUUUUUGCGGUCUGGGCUUGC |
| hsa-miR-129-5p | CUUUUUGCGGUCUGGGCUUGCU | ||||
| miR-139 | 1288 | 1294 | 1A | hsa-miR-139brain | UCUACAGUGCACGUGUCU |
| miR-153 | 1442 | 1449 | 1A,m8 | hsa-miR-153 | UUGCAUAGUCACAAAAGUGA |
| miR-185 | 1540 | 1546 | m8 | hsa-miR-185brain | UGGAGAGAAAGGCAGUUC |
| miR-204/211 | 1993 | 1999 | 1A | hsa-miR-204brain | UUCCCUUUGUCAUCCUAUGCCU |
| hsa-miR-211 | UUCCCUUUGUCAUCCUUCGCCU | ||||
| miR-218 | 1370 | 1376 | m8 | hsa-miR-218brain | UUGUGCUUGAUCUAACCAUGU |
| miR-329 | 1188 | 1194 | m8 | hsa-miR-329brain | AACACACCUGGUUAACCUCUUU |
| miR-342 | 1314 | 1320 | 1A | hsa-miR-342brain | UCUCACACAGAAAUCGCACCCGUC |
| miR-365 | 1395 | 1401 | m8 | hsa-miR-365 | UAAUGCCCCUAAAAAUCCUUAU |
| miR-375 | 1898 | 1904 | 1A | hsa-miR-375 | UUUGUUCGUUCGGCUCGCGUGA |
| miR-448 | 1443 | 1449 | 1A | hsa-miR-448 | UUGCAUAUGUAGGAUGUCCCAU |
| miR-450 | 1132 | 1138 | 1A | hsa-miR-450 | UUUUUGCGAUGUGUUCCUAAUA |
- SZ: miRNAs which differentially expressed in brain cortex of schizophrenia patients comparing with control samples using microarray. Click here to see the list of SZ related miRNAs.
- Brain: miRNAs which are expressed in brain based on miRNA microarray expression studies. Click here to see the list of brain related miRNAs.