Gene Page: BIVM
Summary ?
| GeneID | 54841 |
| Symbol | BIVM |
| Synonyms | - |
| Description | basic, immunoglobulin-like variable motif containing |
| Reference | HGNC:HGNC:16034|Ensembl:ENSG00000134897|HPRD:09827|Vega:OTTHUMG00000017309 |
| Gene type | protein-coding |
| Map location | 13q33.1 |
| Pascal p-value | 0.385 |
| Sherlock p-value | 0.346 |
| Fetal beta | 1.139 |
| DMG | 1 (# studies) |
| eGene | Myers' cis & trans |
Gene in Data Sources
| Gene set name | Method of gene set | Description | Info |
|---|---|---|---|
| CV:PGCnp | Genome-wide Association Study | GWAS | |
| DMG:Nishioka_2013 | Genome-wide DNA methylation analysis | The authors investigated the methylation profiles of DNA in peripheral blood cells from 18 patients with first-episode schizophrenia (FESZ) and from 15 normal controls. | 1 |
Section I. Genetics and epigenetics annotation
 Differentially methylated gene
| Probe | Chromosome | Position | Nearest gene | P (dis) | Beta (dis) | FDR (dis) | Study |
|---|---|---|---|---|---|---|---|
| cg18247638 | 13 | 103451366 | BIVM | -0.021 | 0.43 | DMG:Nishioka_2013 |
eQTL annotation
| SNP ID | Chromosome | Position | eGene | Gene Entrez ID | pvalue | qvalue | TSS distance | eQTL type |
|---|---|---|---|---|---|---|---|---|
| rs1536378 | chr13 | 103472268 | BIVM | 54841 | 0.05 | cis | ||
| rs12405921 | chr1 | 206695730 | BIVM | 54841 | 0.07 | trans |
Section II. Transcriptome annotation
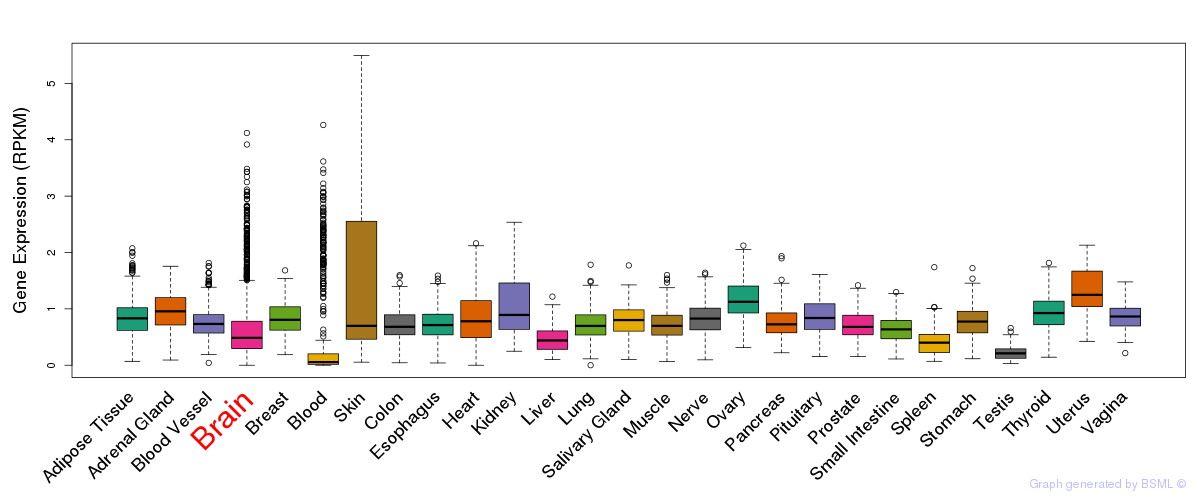
General gene expression (GTEx)
Gene expression during devlopment (BrainCloud)
Footnote:
A total of 269 time points ploted, with n=38 fetal samples (x=1:38). Each triangle represents one time point.
Gene expression of temporal and spatial changes (BrainSpan)
Footnote:
SC: sub-cortical regions; SM: sensory-motor regions; FC: frontal cortex; and TP: temporal-parietal cortex
ST1: fetal (13 - 26 postconception weeks), ST2: early infancy to late childhood (4 months to 11 years), and ST3: adolescence to adulthood (13 - 23 years)
The bar shown representes the lower 25% and upper 25% of the expression distribution.
Top co-expressed genes in brain regions
| Top 10 positively co-expressed genes | ||
| Gene | Pearson's Correlation | Spearman's Correlation |
| SLC25A39 | 0.90 | 0.87 |
| PEMT | 0.85 | 0.81 |
| GSTP1 | 0.85 | 0.79 |
| COPE | 0.84 | 0.84 |
| GPS1 | 0.83 | 0.81 |
| SF3B5 | 0.83 | 0.81 |
| TARBP2 | 0.81 | 0.78 |
| MPDU1 | 0.81 | 0.80 |
| AKR1A1 | 0.81 | 0.80 |
| FLAD1 | 0.81 | 0.79 |
| Top 10 negatively co-expressed genes | ||
| Gene | Pearson's Correlation | Spearman's Correlation |
| AF347015.27 | -0.53 | -0.59 |
| AF347015.8 | -0.52 | -0.58 |
| MT-ATP8 | -0.52 | -0.64 |
| AF347015.15 | -0.51 | -0.58 |
| AF347015.33 | -0.51 | -0.58 |
| AF347015.26 | -0.51 | -0.59 |
| MT-CYB | -0.50 | -0.58 |
| MT-CO2 | -0.49 | -0.54 |
| AF347015.2 | -0.49 | -0.56 |
| AF347015.31 | -0.48 | -0.53 |
Section III. Gene Ontology annotation
| Cellular component | GO term | Evidence | Neuro keywords | PubMed ID |
|---|---|---|---|---|
| GO:0005634 | nucleus | IEA | - | |
| GO:0005737 | cytoplasm | IEA | - |
Section V. Pathway annotation
| Pathway name | Pathway size | # SZGR 2.0 genes in pathway | Info |
|---|---|---|---|
| HORIUCHI WTAP TARGETS UP | 306 | 188 | All SZGR 2.0 genes in this pathway |
| JAATINEN HEMATOPOIETIC STEM CELL UP | 316 | 190 | All SZGR 2.0 genes in this pathway |
| BENPORATH CYCLING GENES | 648 | 385 | All SZGR 2.0 genes in this pathway |
| GEORGES TARGETS OF MIR192 AND MIR215 | 893 | 528 | All SZGR 2.0 genes in this pathway |
| SANSOM APC MYC TARGETS | 217 | 138 | All SZGR 2.0 genes in this pathway |
| SANSOM APC TARGETS REQUIRE MYC | 210 | 123 | All SZGR 2.0 genes in this pathway |
| ACEVEDO LIVER TUMOR VS NORMAL ADJACENT TISSUE UP | 863 | 514 | All SZGR 2.0 genes in this pathway |
| MIKKELSEN ES ICP WITH H3K4ME3 | 718 | 401 | All SZGR 2.0 genes in this pathway |
| MIKKELSEN NPC ICP WITH H3K4ME3 | 445 | 257 | All SZGR 2.0 genes in this pathway |
| WHITFIELD CELL CYCLE S | 162 | 86 | All SZGR 2.0 genes in this pathway |
| JOHNSTONE PARVB TARGETS 3 DN | 918 | 550 | All SZGR 2.0 genes in this pathway |
| WAKABAYASHI ADIPOGENESIS PPARG BOUND 8D | 658 | 397 | All SZGR 2.0 genes in this pathway |
| ZWANG TRANSIENTLY UP BY 1ST EGF PULSE ONLY | 1839 | 928 | All SZGR 2.0 genes in this pathway |
Section VI. microRNA annotation
| miRNA family | Target position | miRNA ID | miRNA seq | ||
|---|---|---|---|---|---|
| UTR start | UTR end | Match method | |||
| miR-146 | 132 | 138 | m8 | hsa-miR-146a | UGAGAACUGAAUUCCAUGGGUU |
| hsa-miR-146bbrain | UGAGAACUGAAUUCCAUAGGCU | ||||
| miR-28 | 1254 | 1260 | m8 | hsa-miR-28brain | AAGGAGCUCACAGUCUAUUGAG |
| miR-495 | 1603 | 1609 | 1A | hsa-miR-495brain | AAACAAACAUGGUGCACUUCUUU |
- SZ: miRNAs which differentially expressed in brain cortex of schizophrenia patients comparing with control samples using microarray. Click here to see the list of SZ related miRNAs.
- Brain: miRNAs which are expressed in brain based on miRNA microarray expression studies. Click here to see the list of brain related miRNAs.