Gene Page: EIF3M
Summary ?
| GeneID | 10480 |
| Symbol | EIF3M |
| Synonyms | B5|GA17|PCID1|TANGO7|hfl-B5 |
| Description | eukaryotic translation initiation factor 3 subunit M |
| Reference | MIM:609641|HGNC:HGNC:24460|HPRD:09969| |
| Gene type | protein-coding |
| Map location | 11p13 |
| Pascal p-value | 0.061 |
| Sherlock p-value | 0.428 |
| Fetal beta | 0.839 |
| DMG | 1 (# studies) |
Gene in Data Sources
| Gene set name | Method of gene set | Description | Info |
|---|---|---|---|
| CV:PGCnp | Genome-wide Association Study | GWAS | |
| DMG:Jaffe_2016 | Genome-wide DNA methylation analysis | This dataset includes 2,104 probes/CpGs associated with SZ patients (n=108) compared to 136 controls at Bonferroni-adjusted P < 0.05. | 1 |
Section I. Genetics and epigenetics annotation
 Differentially methylated gene
| Probe | Chromosome | Position | Nearest gene | P (dis) | Beta (dis) | FDR (dis) | Study |
|---|---|---|---|---|---|---|---|
| cg18788872 | 11 | 32605728 | EIF3M | 1.58E-9 | -0.017 | 1.45E-6 | DMG:Jaffe_2016 |
Section II. Transcriptome annotation
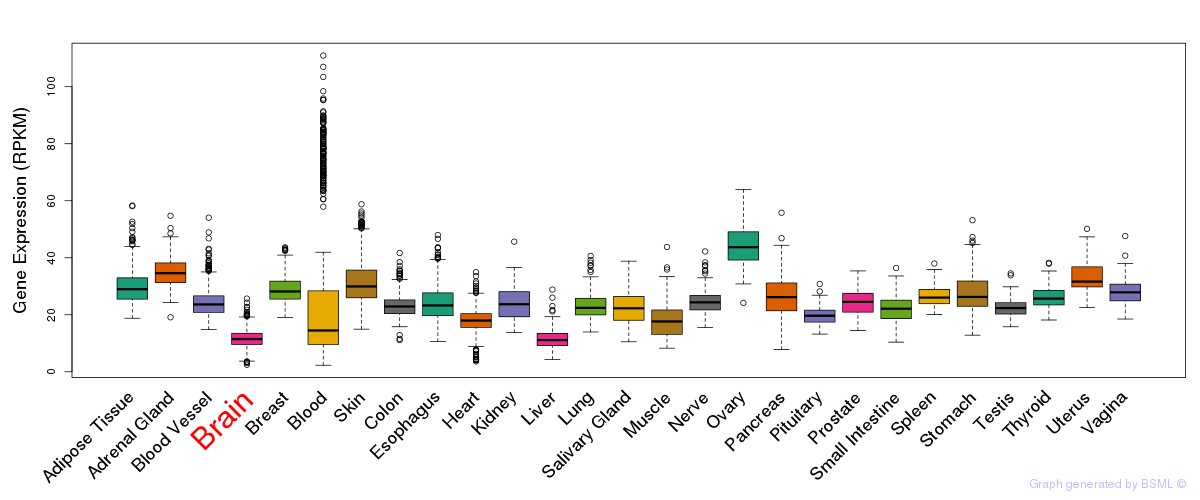
General gene expression (GTEx)
Gene expression during devlopment (BrainCloud)
Footnote:
A total of 269 time points ploted, with n=38 fetal samples (x=1:38). Each triangle represents one time point.
Gene expression of temporal and spatial changes (BrainSpan)
Footnote:
SC: sub-cortical regions; SM: sensory-motor regions; FC: frontal cortex; and TP: temporal-parietal cortex
ST1: fetal (13 - 26 postconception weeks), ST2: early infancy to late childhood (4 months to 11 years), and ST3: adolescence to adulthood (13 - 23 years)
The bar shown representes the lower 25% and upper 25% of the expression distribution.
Top co-expressed genes in brain regions
| Top 10 positively co-expressed genes | ||
| Gene | Pearson's Correlation | Spearman's Correlation |
| GNG11 | 0.68 | 0.75 |
| RHOC | 0.66 | 0.63 |
| CD58 | 0.65 | 0.63 |
| SERPINB6 | 0.64 | 0.65 |
| NMI | 0.63 | 0.64 |
| S100A11 | 0.62 | 0.65 |
| DBI | 0.62 | 0.68 |
| PPIC | 0.61 | 0.60 |
| IGFBP7 | 0.61 | 0.66 |
| FCGRT | 0.59 | 0.54 |
| Top 10 negatively co-expressed genes | ||
| Gene | Pearson's Correlation | Spearman's Correlation |
| SPTBN2 | -0.58 | -0.63 |
| CACNA1C | -0.57 | -0.64 |
| TTBK1 | -0.55 | -0.61 |
| SPTBN4 | -0.55 | -0.60 |
| CACNA1B | -0.55 | -0.63 |
| AC135592.2 | -0.55 | -0.64 |
| R3HDM2 | -0.55 | -0.59 |
| MAPK8IP3 | -0.55 | -0.62 |
| HIVEP3 | -0.54 | -0.65 |
| ANK3 | -0.54 | -0.61 |
Section V. Pathway annotation
| Pathway name | Pathway size | # SZGR 2.0 genes in pathway | Info |
|---|---|---|---|
| GAZDA DIAMOND BLACKFAN ANEMIA ERYTHROID DN | 493 | 298 | All SZGR 2.0 genes in this pathway |
| DIAZ CHRONIC MEYLOGENOUS LEUKEMIA UP | 1382 | 904 | All SZGR 2.0 genes in this pathway |
| OSWALD HEMATOPOIETIC STEM CELL IN COLLAGEN GEL UP | 233 | 161 | All SZGR 2.0 genes in this pathway |
| KINSEY TARGETS OF EWSR1 FLII FUSION UP | 1278 | 748 | All SZGR 2.0 genes in this pathway |
| DODD NASOPHARYNGEAL CARCINOMA DN | 1375 | 806 | All SZGR 2.0 genes in this pathway |
| SCHLOSSER SERUM RESPONSE DN | 712 | 443 | All SZGR 2.0 genes in this pathway |
| PUJANA BRCA1 PCC NETWORK | 1652 | 1023 | All SZGR 2.0 genes in this pathway |
| PUJANA ATM PCC NETWORK | 1442 | 892 | All SZGR 2.0 genes in this pathway |
| PUJANA CHEK2 PCC NETWORK | 779 | 480 | All SZGR 2.0 genes in this pathway |
| TCGA GLIOBLASTOMA COPY NUMBER UP | 75 | 36 | All SZGR 2.0 genes in this pathway |
| MOREAUX MULTIPLE MYELOMA BY TACI DN | 172 | 107 | All SZGR 2.0 genes in this pathway |
| BAELDE DIABETIC NEPHROPATHY DN | 434 | 302 | All SZGR 2.0 genes in this pathway |
| KRIGE RESPONSE TO TOSEDOSTAT 6HR DN | 911 | 527 | All SZGR 2.0 genes in this pathway |
| KRIGE RESPONSE TO TOSEDOSTAT 24HR DN | 1011 | 592 | All SZGR 2.0 genes in this pathway |
| CREIGHTON ENDOCRINE THERAPY RESISTANCE 1 | 528 | 324 | All SZGR 2.0 genes in this pathway |
| GAVIN FOXP3 TARGETS CLUSTER T7 | 98 | 63 | All SZGR 2.0 genes in this pathway |
| STEARMAN LUNG CANCER EARLY VS LATE UP | 125 | 89 | All SZGR 2.0 genes in this pathway |
| ACEVEDO LIVER TUMOR VS NORMAL ADJACENT TISSUE UP | 863 | 514 | All SZGR 2.0 genes in this pathway |
| WEST ADRENOCORTICAL TUMOR DN | 546 | 362 | All SZGR 2.0 genes in this pathway |
| CHAUHAN RESPONSE TO METHOXYESTRADIOL DN | 102 | 65 | All SZGR 2.0 genes in this pathway |
| CAIRO HEPATOBLASTOMA CLASSES UP | 605 | 377 | All SZGR 2.0 genes in this pathway |
| BILANGES SERUM AND RAPAMYCIN SENSITIVE GENES | 68 | 35 | All SZGR 2.0 genes in this pathway |
| FEVR CTNNB1 TARGETS DN | 553 | 343 | All SZGR 2.0 genes in this pathway |